Building a Prometheus and Grafana Observability Stack for My Home Lab
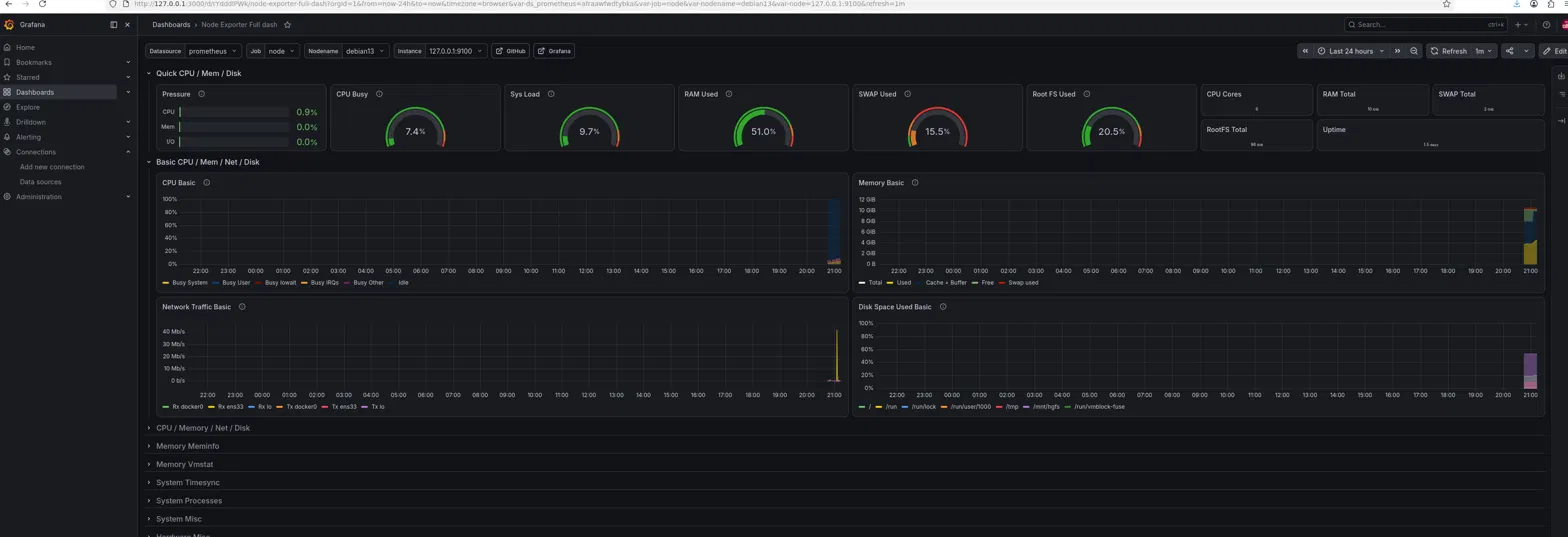
My LaMetric display gives an at-a-glance read on the lab, but it’s a spot reading with no history — good for “is something on fire right now,” useless for “what happened overnight.” This project adds the layer underneath: a Prometheus + Grafana stack that scrapes my hosts continuously, stores the history, and draws real dashboards. Two targets: CLAUDDEB (my Debian automation VM) and my pfSense firewall, reusing the exact SNMP setup from the pfSense post — just pointed at something far more capable than a 37-pixel display. ...