Self-Hosted WireGuard Through a Nested Firewall — and the Four-Layer Debug to Make It Work
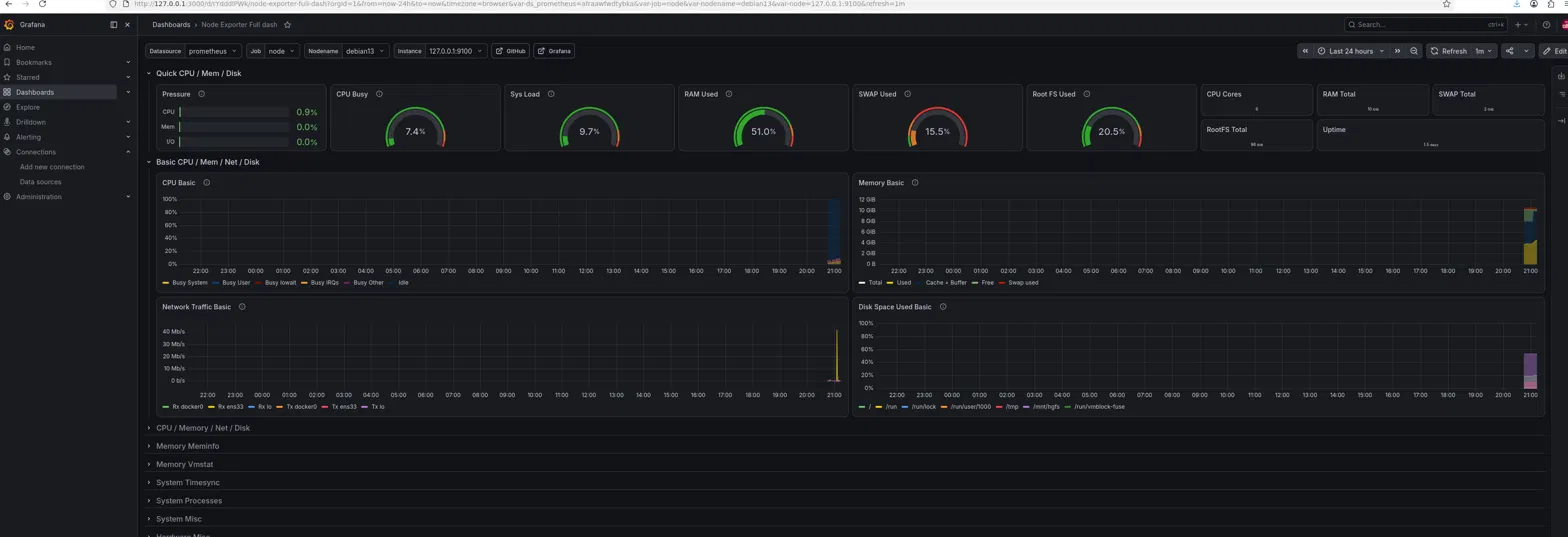
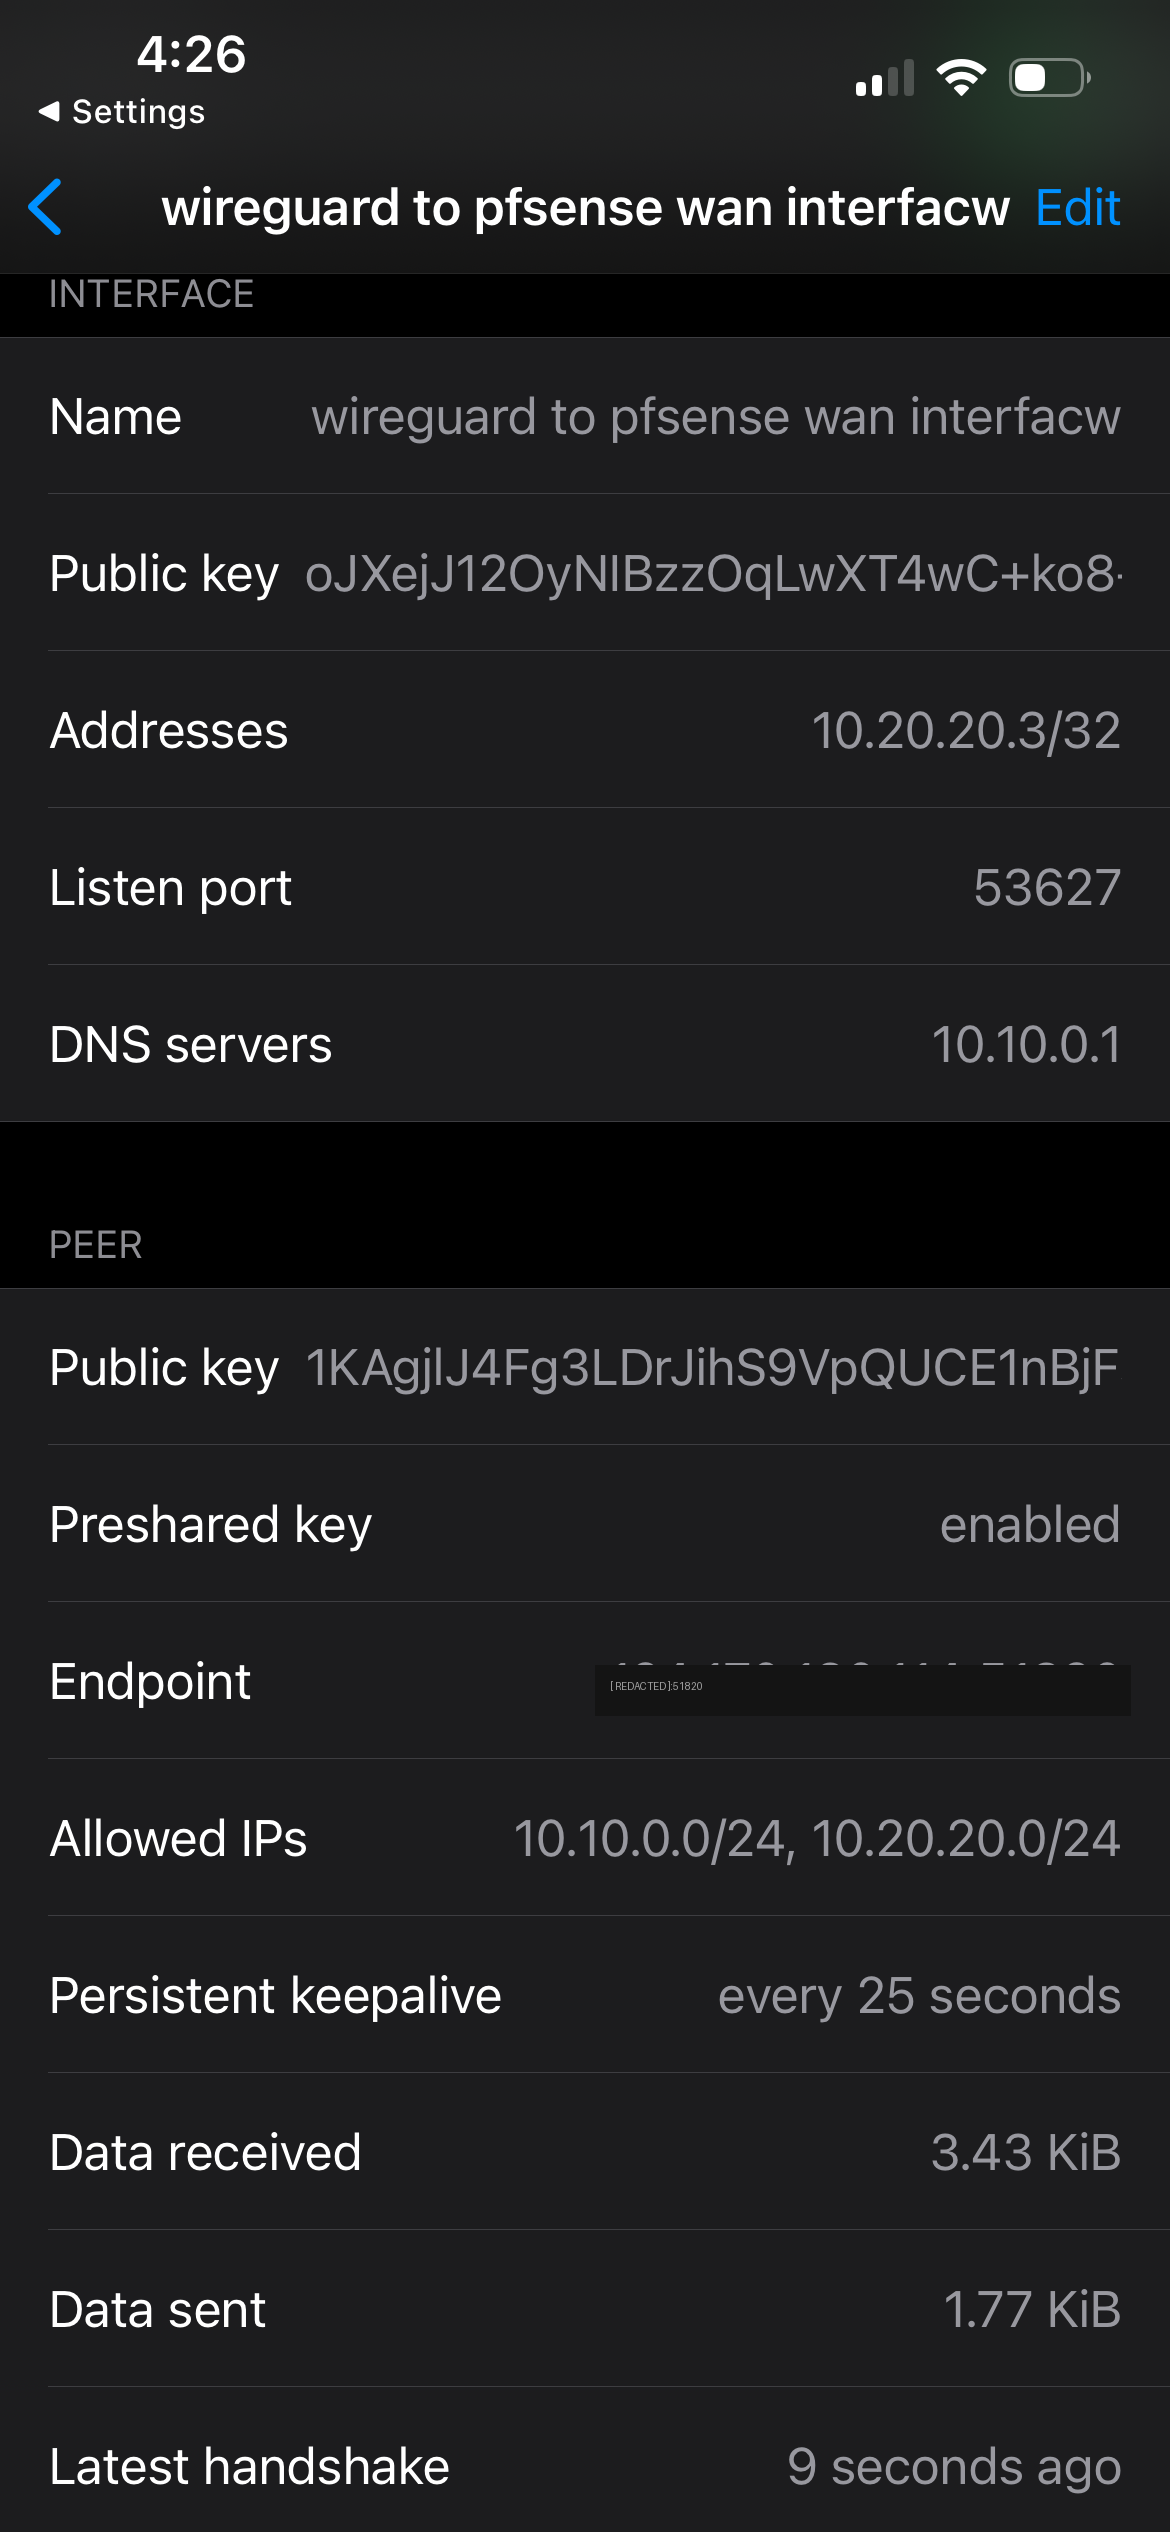
My lab is deliberately isolated — an automation VM (CLAUDDEB) sits behind a virtual pfSense firewall on a segment (10.10.0.0/24) that my home network can’t reach. That isolation is great until you’re out of the house and want to check your Grafana dashboards, which only listen inside that segment. I already use Tailscale for casual remote access, and I’ll be honest up front: for pure convenience, Tailscale wins — it punches through NAT automatically with zero firewall work. But this project wasn’t about convenience. It was about building the thing Tailscale is made of. Tailscale is WireGuard under the hood; hand-rolling raw WireGuard on pfSense teaches you how VPNs actually work — keys, peers, routing, firewall rules, NAT — at a level the managed tool deliberately hides. So I built it from scratch, kept Tailscale as my daily driver, and got a genuinely brutal debugging lesson in the process. ...