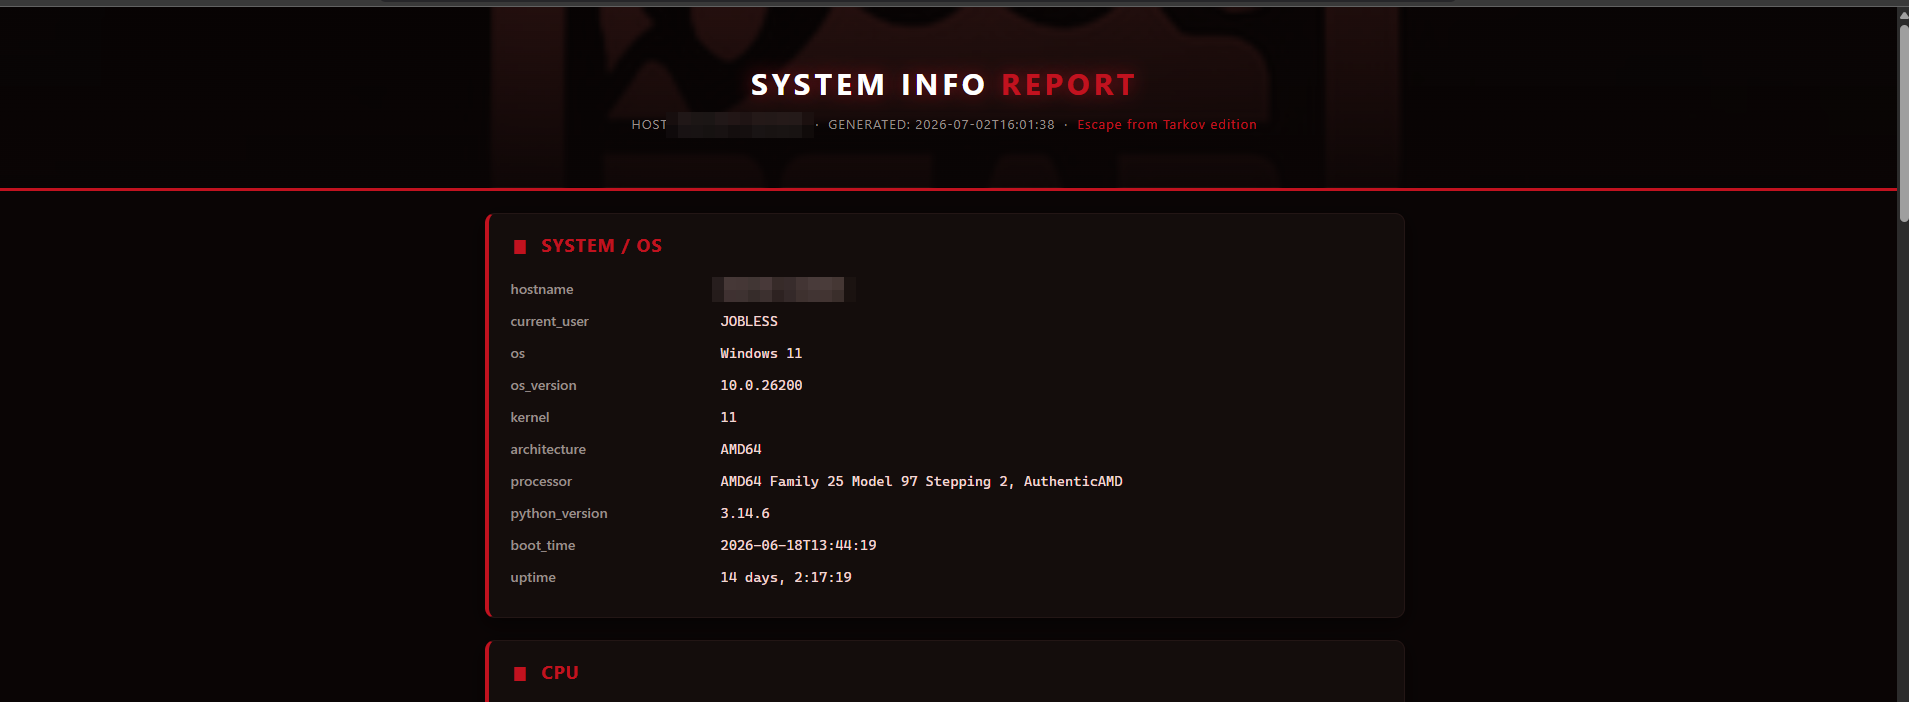
I wanted a small desktop tool that captures a snapshot of a machine — hardware, resource usage, network state — and writes it to a styled HTML report viewable in any browser. Useful for quick system audits and for keeping a record of a machine’s specs over time. I built it in one Claude Code session (Opus 4.8) on my Debian 13 laptop, then packaged it for Windows as well.
The prompt that started it
The entire specification was one sentence:
can you create me a simple local program for myself with fancy gui with the whole purpose of gathering system information and it generating to a file location of whatever chose in the input, give me any prompt of info if you require
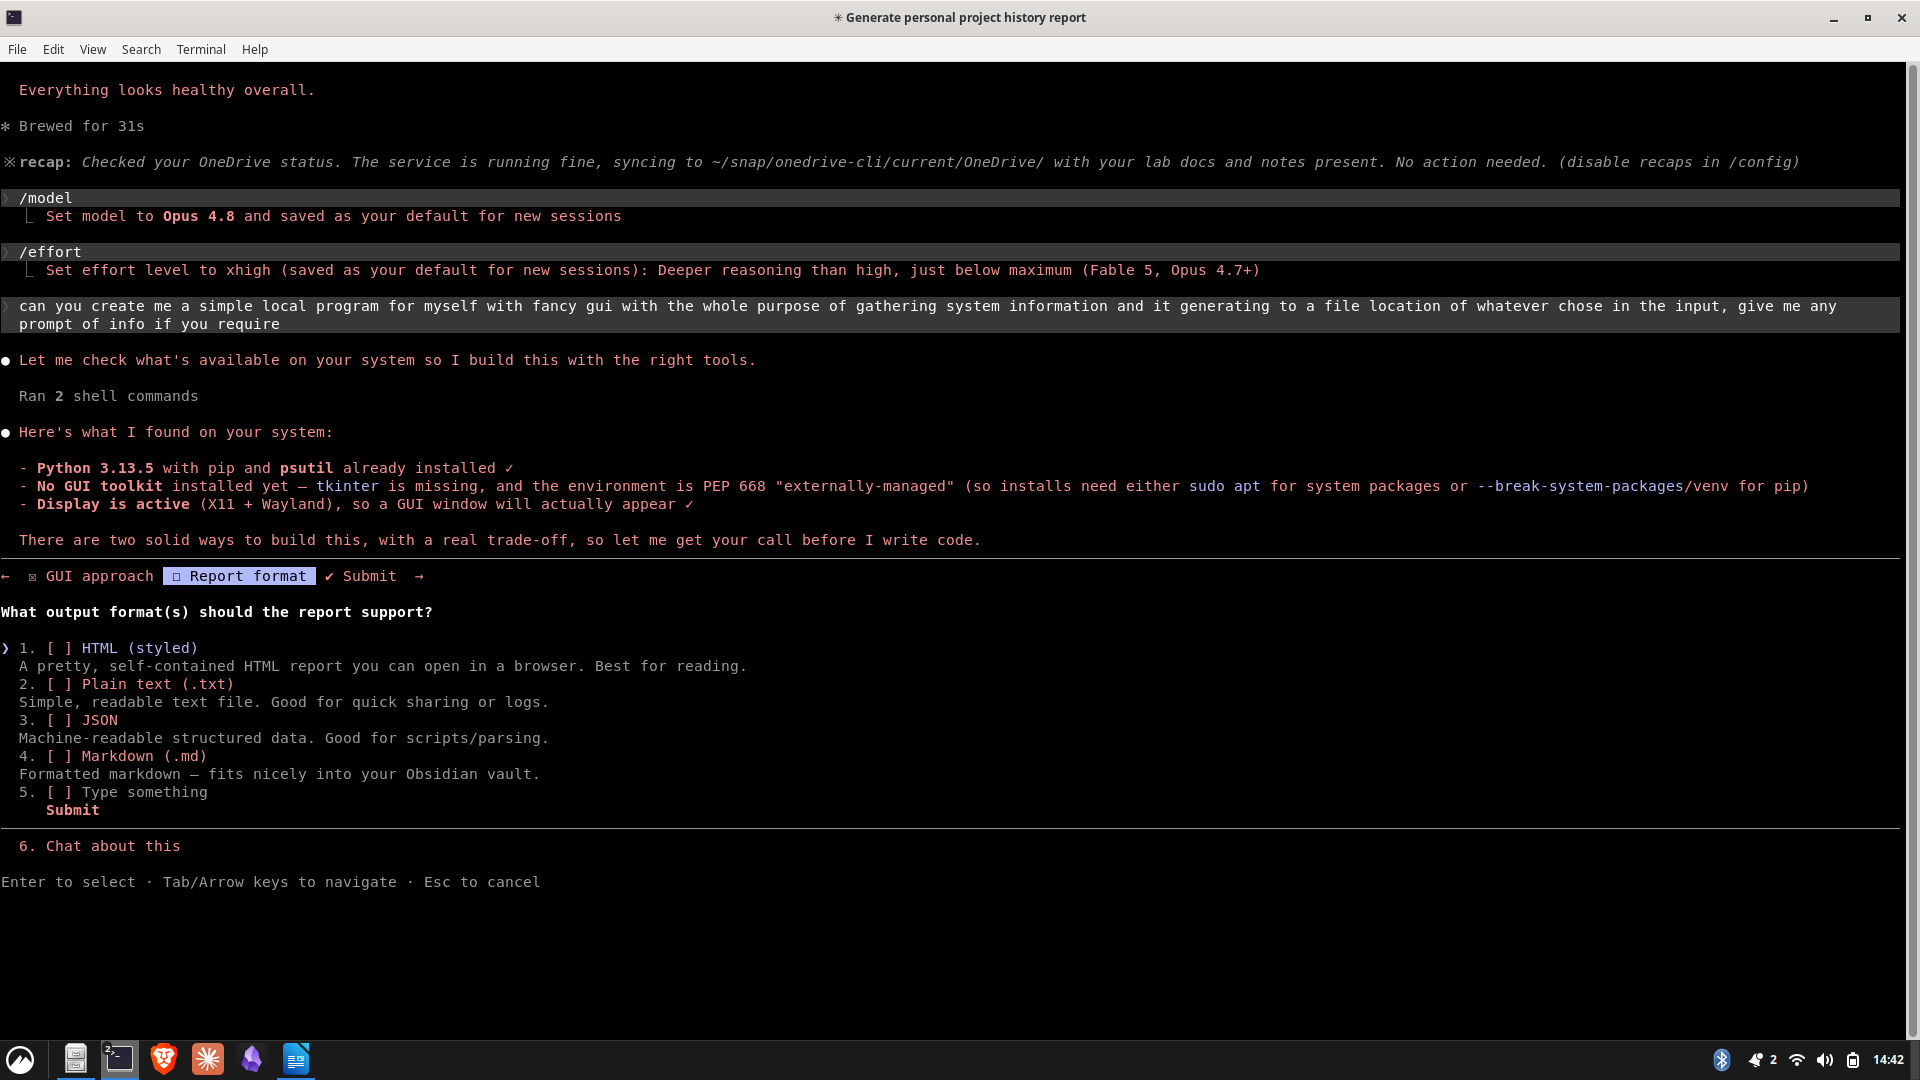
What Claude did first mattered more than the code: it inspected the machine before writing anything. It found Python 3.13.5 with psutil installed, no GUI toolkit, and a PEP 668 externally-managed environment — then asked structured questions about GUI approach and output format instead of guessing. I chose a native desktop window and HTML output.
First working version
| Choice | Decision |
|---|---|
| GUI framework | customtkinter — native dark-mode desktop window |
| System info source | psutil |
| Output format | Styled, self-contained HTML report |
| Packaging | PyInstaller — single-file executable |
| Design | Background thread + live progress bar; each probe isolated so one failure won’t crash the app |
After installing the missing Tk dependency (pkexec apt install -y python3-tk), the first version came up: a dark window with category checkboxes, an output folder picker, and a generate button.
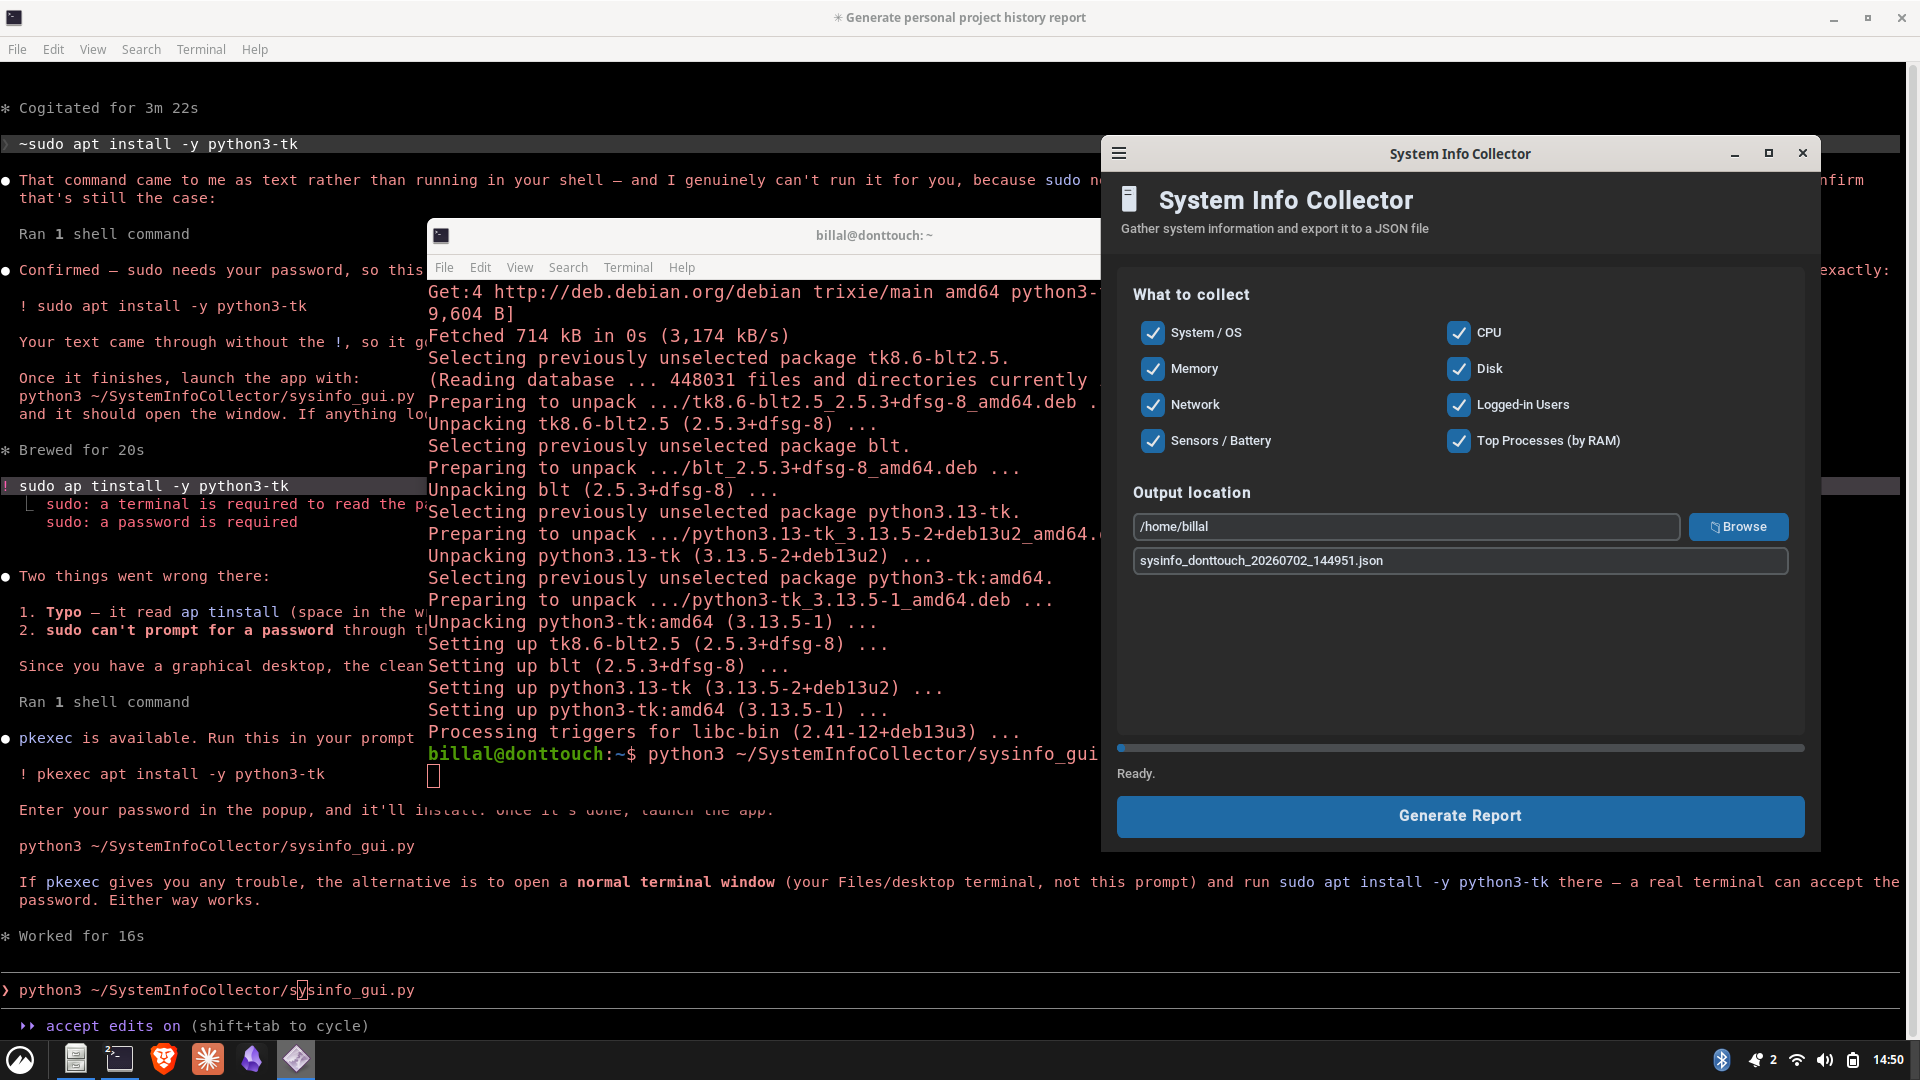
It collects eight categories:
| Category | Details |
|---|---|
| System / OS | Hostname, user, OS, kernel, architecture, boot time, uptime |
| CPU | Physical/logical cores, frequency, per-core usage, load average |
| Memory | RAM and swap — total / used / available / percent |
| Disk | Every mounted partition (size, used, free) + total I/O |
| Network | Interfaces, IP/MAC addresses, bytes sent/received, active connections |
| Logged-in Users | Active user sessions |
| Sensors / Battery | Battery %, power state, temperatures (if available) |
| Top Processes | 15 heaviest processes by RAM |
Upgrade rounds
- Tarkov re-skin. A darkened Escape from Tarkov BEAR emblem became the window background (processed with Pillow — brightness, red duotone, vignette), and the interface was recoloured red/black to match this blog.
- JSON → HTML. The plain JSON export became the styled, self-contained report at the top of this post — emblem embedded as base64, one table per section, optional auto-open in the browser.
- Optimisation and security hardening:
- Fixed per-core CPU usage returning zeros — now one accurate 1-second sample, with the total as the mean.
- Path-traversal guard: output filenames are stripped to a basename so they can’t escape the chosen folder.
- HTML-injection safe: every dynamic value is escaped, verified with an injected
<script>payload. - Browser auto-open uses
Path.as_uri(), which handles spaces correctly. - The embedded emblem is computed once and cached; asset paths resolve correctly when running as a frozen executable.
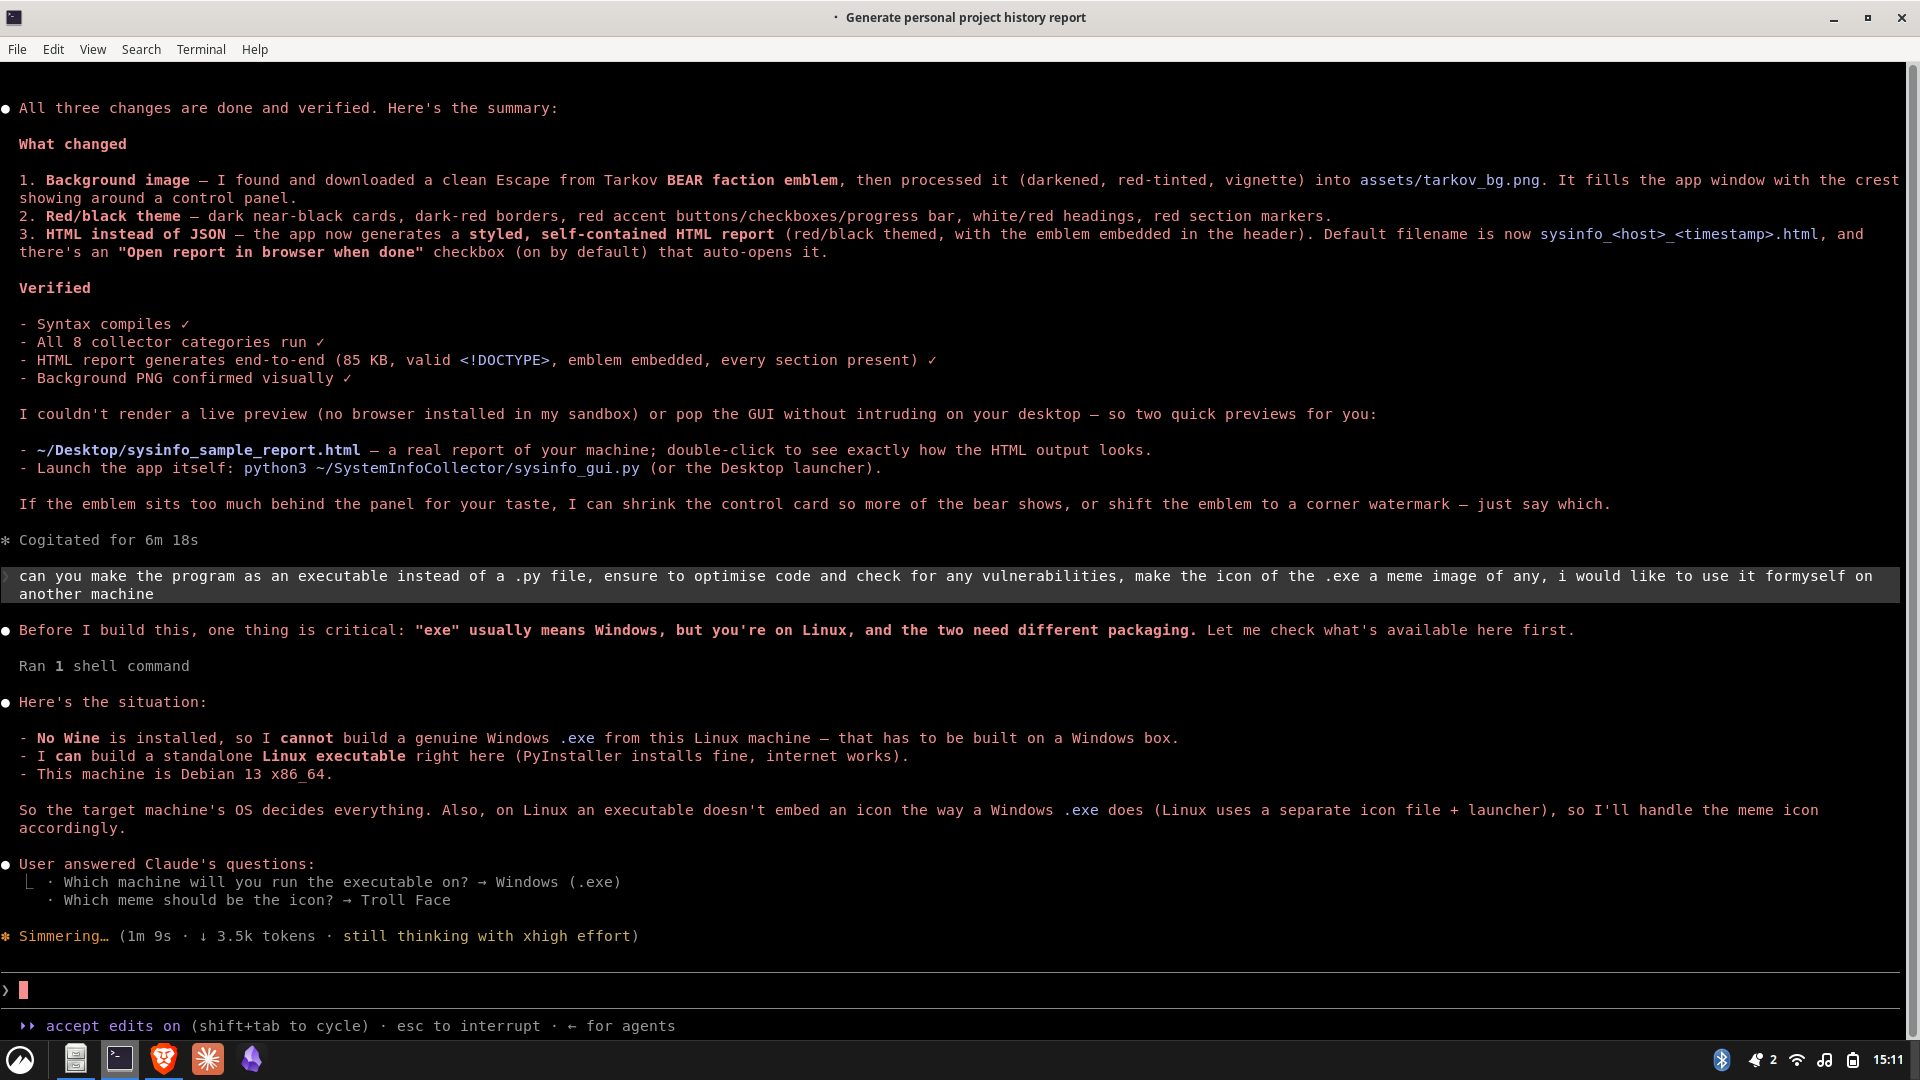
Packaging — Linux executable and a Windows build kit
PyInstaller bundled the app into a standalone Linux executable (~18 MB) — no Python needed to run it.
A Windows .exe can’t be cross-built from Linux, so the project ships a Windows_Build_Kit/ instead: build.bat, the source, requirements.txt, theme assets, and a README. Copy to a Windows PC, run build.bat, and it produces the executable locally.
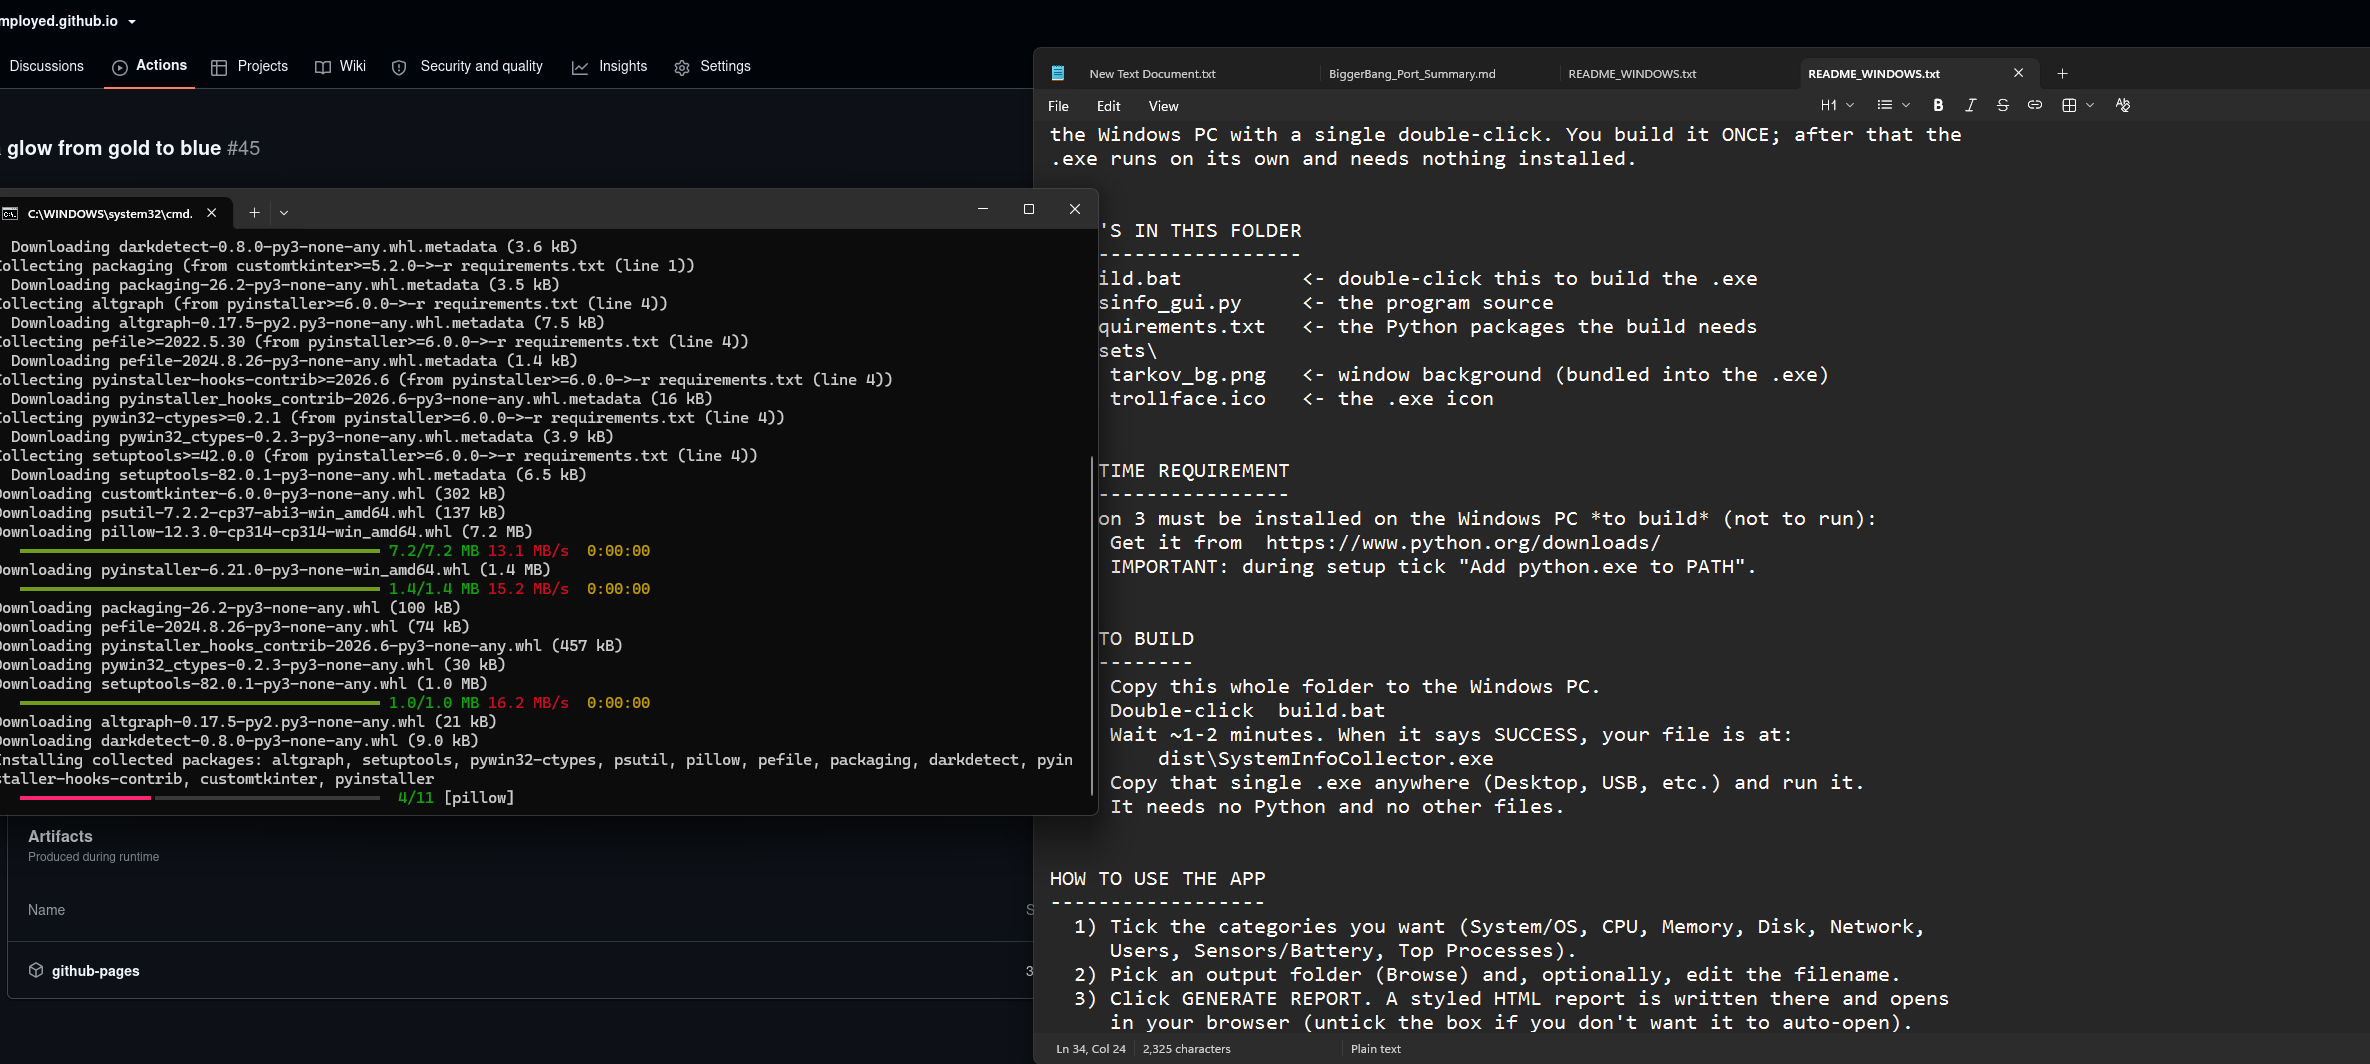
That’s how it went on my Windows PC — one run of build.bat, and the resulting exe (~19 MB) launches the same red/black GUI:
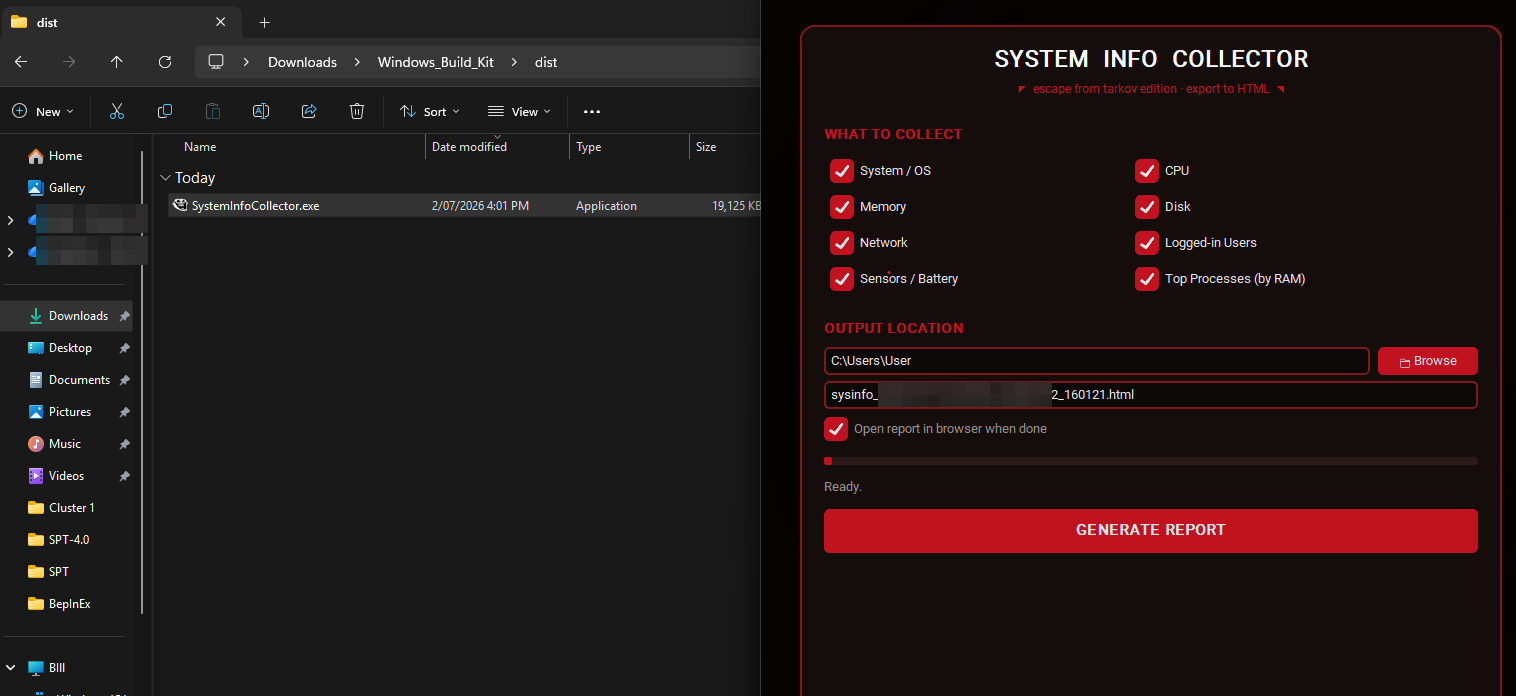
Verification
- Data-gathering tested headless — 16 logical cores, 15 GB RAM, 8 disks read correctly; all 8 collector categories passed.
- HTML report confirmed valid and self-contained.
<script>injection test confirmed escaping works.- Linux executable smoke-tested: clean launch, assets and theme loaded, no errors.
- The Windows build command was validated on the Linux machine before shipping the kit.
How I use it
- Launch the app (desktop launcher or the executable directly).
- Tick the categories to collect.
- Choose the output folder and optionally edit the filename (defaults to
sysinfo_<hostname>_<timestamp>.html). - Click GENERATE REPORT — the report saves and opens in the browser.
Small tool, but the workflow is the takeaway: one plain-English prompt, a model that inspects the environment and asks before building, and an afternoon later there’s a hardened, packaged program running on two operating systems.