Since I built the homelab server and kept adding more things to it, some of the older services that had been running for a while started to become funky and stopped operating properly. Some just quietly stopped working altogether.
The scanner that reported a clean result while scanning nothing
The whole thing started about a week ago. First it was the vulnerability scanner claiming a clean result — which turned out to be it scanning nothing at all.
- The scan claimed 0 open ports, which contradicted previous runs that had found 6–7.
- The cause was a hardcoded Docker bridge gateway. Docker had moved the network to a new range, so the address it had been scanning the entire time no longer existed.
nmap -Pndoes not error on a dead target. It reports the host as up with all ports filtered. So the run was technically clean — there was genuinely nothing to show — and the result read as a hardened host rather than a failed scan. A failed scan would have looked completely different.- The fix was to resolve the gateway at runtime, and to warn loudly if a scan ever returns 0 open ports again.
Lesson: a wrong answer that looks like good news is worse than no answer at all.
The rest of them
There were plenty of other issues that came up and got resolved along the way:
- a detection rule that matched its own error message
- an alert that was correct and wrong at the same time
- a log source that looked dead but was just quiet
- verifying patched images properly instead of trusting “just pull the images”
- a certificate swap on the firewall that went backwards before it went forwards
- a whole month of notes that were meant to be synced, sitting locally on the server the entire time
- the AI analyst losing access to its own designated directory
- a queue in the observability stack throwing an error every 31 seconds, for a feature that was never configured
- runbooks six weeks behind, with documents completely out of date
None of those compare to the one I spent the most time on, though.
The NTP server that said “do not trust me” for months
This is the one that ate me alive. No matter how many diagnostics I went through, it kept coming back. I even had to correct Claude’s judgement several times — more than once it went off diagnosing a completely different scope of the project that had nothing to do with the actual issue.
Here is the full breakdown.
The symptom
The lab’s clock kept drifting after suspends. I fixed it three times. It kept coming back.
The cause, found by replacing the tool rather than debugging harder
systemd-timesyncd contacts servers “in turn, until one responds”. It uses
the first responder and never compares sources. A config comment in my own
setup claimed that listing extra pool servers meant “one bad upstream cannot
define the lab’s idea of now” — that is simply not how timesyncd works. The
mitigation had never worked at any point.
Diagnosis
- I swapped to chrony, which polls every source, compares them, and rejects
the outlier. Within seconds it refused the firewall entirely:
Reach 0, never used. - Probing the firewall directly showed
leap=3— the NTP leap indicator, meaning “I am not synchronised, do not use me”. It had been answering every single query with that flag set, while reporting a healthy-looking stratum 2. - My own exporter was reporting it as healthy. It set
lab_ntp_server_up = 1whenever a packet came back and never read the leap indicator. A green light that meant “something replied”, not “the answer is usable”. - timesyncd had also silently wedged. Its last successful sync was the exact
moment the host suspended two days earlier, while it reported
NTP service: activethe whole time.
Part two — day four, two more fixes
Fix 1: the timer underneath the clock was wrong
- The firewall’s status page showed 1273–1802 ms of jitter. Its own documentation says that above roughly 100 ms the NTP daemon is “almost useless”. I was at 10–18 times that.
- The cause is that the OS picks its clock source by a quality score. The one it picked scores highest on paper and is the wrong choice inside a VM — the hypervisor deschedules the CPU and the counter stops tracking real time.
- Switching to a dedicated hardware timer took root dispersion from 2.958s to 0.208s. The readings became stable for the first time.
- Nothing was misconfigured. A fresh install of the same firewall makes the same choice. Automatic selection optimises for bare metal.
- Worth a line: this firewall ignores the two config files you would normally use to persist a kernel tunable. Only the GUI’s tunables page works. Someone on the vendor forum lost a lot of time to that.
Fix 2: a setting that meant the opposite of what it looked like
- One upstream was ticked Prefer — “trust this one when sources disagree”.
- It was a pool hostname. A pool resolves to a different volunteer server on every lookup. So it granted veto power to a random machine and destroyed the outlier rejection that running four sources exists to provide.
- Same shape as the timesyncd bug above: a setting that reads like a safeguard and behaves like its removal.
And then the interesting part
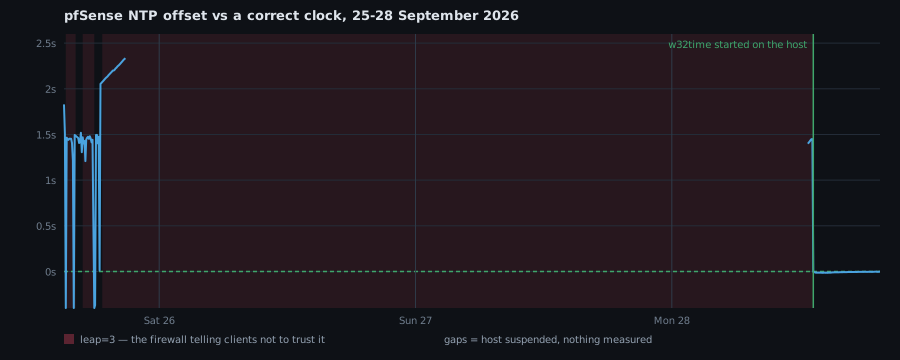
After both fixes, the leap indicator went from 3 to 0 for the first time all week. The firewall stopped declaring itself unusable.
It was still exactly two seconds fast.
The fixes had converted “unsynchronised and obviously broken” into “synchronised, confident, and two seconds wrong” — which is worse, because now everything downstream believes it.
Part three — it was never the firewall
At this point I’d fixed two real things and the offset hadn’t moved. So I stopped guessing and measured the one number nobody had: how fast it was getting worse.
1.943 → 1.998 → 2.002 → 2.021 → 2.031
That’s the offset over 45 minutes. A constant slope of +32.6 PPM. chrony had already measured this host’s own oscillator at +32.4 PPM — the same hardware, the same hypervisor, the same number. So the firewall’s clock wasn’t faulty, it was just free-running while nothing corrected it.
But that only explained the slow creep, not the two seconds. At 32 PPM a clock needs about 17 hours to accumulate two seconds. Mine was doing it in five minutes, and it kept landing on the same value. Drift doesn’t do that. Only something setting the clock does.
Measuring the host from inside the guest
The suspect was now the Windows host underneath. What I didn’t expect is that I never had to leave the VM to check — VMware Tools exposes the host’s clock to the guest:
vmware-toolbox-cmd stat hosttime
It only reports whole seconds, which isn’t precise enough for a two-second
question. So instead of reading it once, I polled it in a tight loop and caught
the instant it ticked over. At that moment the host is exactly on .000, so
whatever sub-second value my own clock shows is the difference between them.
Six samples, all within 60 ms of each other:
-1.349  -1.412  -1.357  -1.401  -1.362  -1.372
median: -1.367s
The Windows host was 1.367 seconds fast. My Linux VM, on that same host, was accurate to 0.0003 seconds.
The control experiment was already running
That difference is the whole thing. Two guests, one hypervisor, one of them perfect and one of them wrong. The only setting that differed:
$ vmware-toolbox-cmd timesync status
Disabled
Periodic host-to-guest time sync was off on the Linux VM and on for the firewall. So chrony governed one clock alone, while the other was being overwritten with the host’s wrong time every few minutes. The firewall’s NTP daemon would correct it, VMware would push it back, forever.
I’d had the experiment sitting in front of me the entire time and hadn’t recognised it.
The actual root cause
On the Windows host, as Administrator:
w32tm /resync /force
The following error occurred: The service has not been started. (0x80070426)
The Windows Time service was stopped. Not misconfigured, not failing —
simply not running. On a machine that isn’t domain-joined, Windows leaves
w32time on Manual (Trigger Start): it starts on certain events, stops again,
and nothing anywhere tells you. The clock had been free-running on the
motherboard oscillator for who knows how long.
Two fixes, not one
Set-Service w32time -StartupType Automatic
Start-Service w32time
w32tm /config /manualpeerlist:"0.au.pool.ntp.org 1.au.pool.ntp.org" /syncfromflags:manual /update
Restart-Service w32time
w32tm /resync /force
Automatic matters as much as Start-Service. Without it the service stops
again at some point and the whole thing comes back with no warning.
Then on the firewall itself:
vmware-toolbox-cmd timesync disable
Correcting the host removes the wrong value. Disabling periodic guest sync removes the mechanism. Only doing the first leaves you one stopped service away from repeating the entire week.
Worth saying: this does not undo the guest-tools fix I made earlier in the month for suspend/resume drift. VMware Tools does two different kinds of time sync — periodic, which is the one fighting the NTP daemon, and event-driven, which corrects after a resume and happens regardless of this setting.
The result
| Before | After | |
|---|---|---|
| Windows host | +1.367 s | −0.050 s |
Firewall leap | 3 | 0 |
| Firewall offset | +2.00 s | −0.004 s |
| Root dispersion | 2.958 s | 0.011 s |
| chrony reach | 0 | 377 |
Root dispersion improved by a factor of 270. chrony now measures the firewall at 8 ms, from a source it was calling a falseticker that morning.
What I’d take from this
I spent three days treating the firewall as broken. It wasn’t. It was the only
component in the entire chain reporting the problem honestly — leap=3
means “do not trust me”, and that was true every second it said it. Everything
else either didn’t look, or looked and said it was fine.
The fault was one layer below everything I was monitoring. Every tool in this lab compares itself against the lab. Nothing was checking the machine the lab runs on, so a stopped service on the Windows host stayed invisible for months while four different things downstream reported healthy.
And it was a stopped service with no alarm attached. Not a crash, not a misconfiguration — a default nobody chose, on a service nobody watches, doing exactly what it was set to do.
The part I’ll actually remember is measuring the slope. One number, taken over 45 minutes, split a single confusing symptom into two unrelated faults and proved which one couldn’t possibly be the cause. I’d been arguing with the evidence for days. I should have measured it on day one.
I run this lab as an AI-assisted workflow. I direct the work, decide what changes, run anything needing root, and push back on answers that smell wrong. Claude Code did the investigation and took the measurements in this post.
That pushback mattered here more than usual. Early on it blamed the VMware guest tools on a hunch, and I told it the timeline didn’t support that — we’d had the drift before the tools were installed, and installing them had fixed the resume problem. It dropped the theory. Four days later the tools turned out to be part of the answer after all, but for a completely different reason and with completely different evidence: a fixed, repeating offset rather than a drifting one. It was right to drop it the first time. A hunch that happens to land near the truth is still a hunch.