My LaMetric display gives an at-a-glance read on the lab, but it’s a spot reading with no history — good for “is something on fire right now,” useless for “what happened overnight.” This project adds the layer underneath: a Prometheus + Grafana stack that scrapes my hosts continuously, stores the history, and draws real dashboards.
Two targets: CLAUDDEB (my Debian automation VM) and my pfSense firewall, reusing the exact SNMP setup from the pfSense post — just pointed at something far more capable than a 37-pixel display.
Where it runs, and why
The whole stack lives on CLAUDDEB, and that falls out of how Prometheus works. Prometheus is pull-based: it reaches out to each target and scrapes its metrics, rather than targets pushing to it. So placement is decided by reachability. My targets are node_exporter on CLAUDDEB itself (localhost) and pfSense (the gateway CLAUDDEB is already allowed to reach). Anywhere else, Prometheus would have to scrape across my network isolation into the lab segment — which the containment blocks. Running it inside the segment, next to the data, keeps everything self-contained with no new firewall holes.
The consequence: Grafana lives on localhost:3000, viewed from CLAUDDEB’s own desktop. Reaching it from another machine would be a separate, scoped decision (a firewall rule or a VPN), left for later.
The tools
- Prometheus (port 9090) — the core: a time-series database that scrapes targets on a schedule, stores the numbers over time, and answers queries in its own language, PromQL.
- node_exporter (port 9100) — exposes a host’s own metrics (CPU, memory, disk, network, filesystem) as a page of numbers for Prometheus to scrape. This is how CLAUDDEB’s health gets in.
- snmp_exporter (port 9116) — a translator. Prometheus speaks HTTP; pfSense speaks SNMP. The exporter sits between: Prometheus asks it over HTTP, it queries pfSense over SNMP (the same interface counters as last time), and hands back Prometheus-style metrics.
- Grafana (port 3000) — the dashboards. It stores nothing itself; it queries Prometheus on demand and draws the graphs.
- systemd — runs each of the above as a service that starts on boot, the same pattern as my LaMetric pusher.
The build, in order
Each piece got a locked-down service user (no home, no login), a systemd unit, and — importantly — was bound to localhost only. I verified each layer before adding the next.
- node_exporter — installed, confirmed it served metrics at
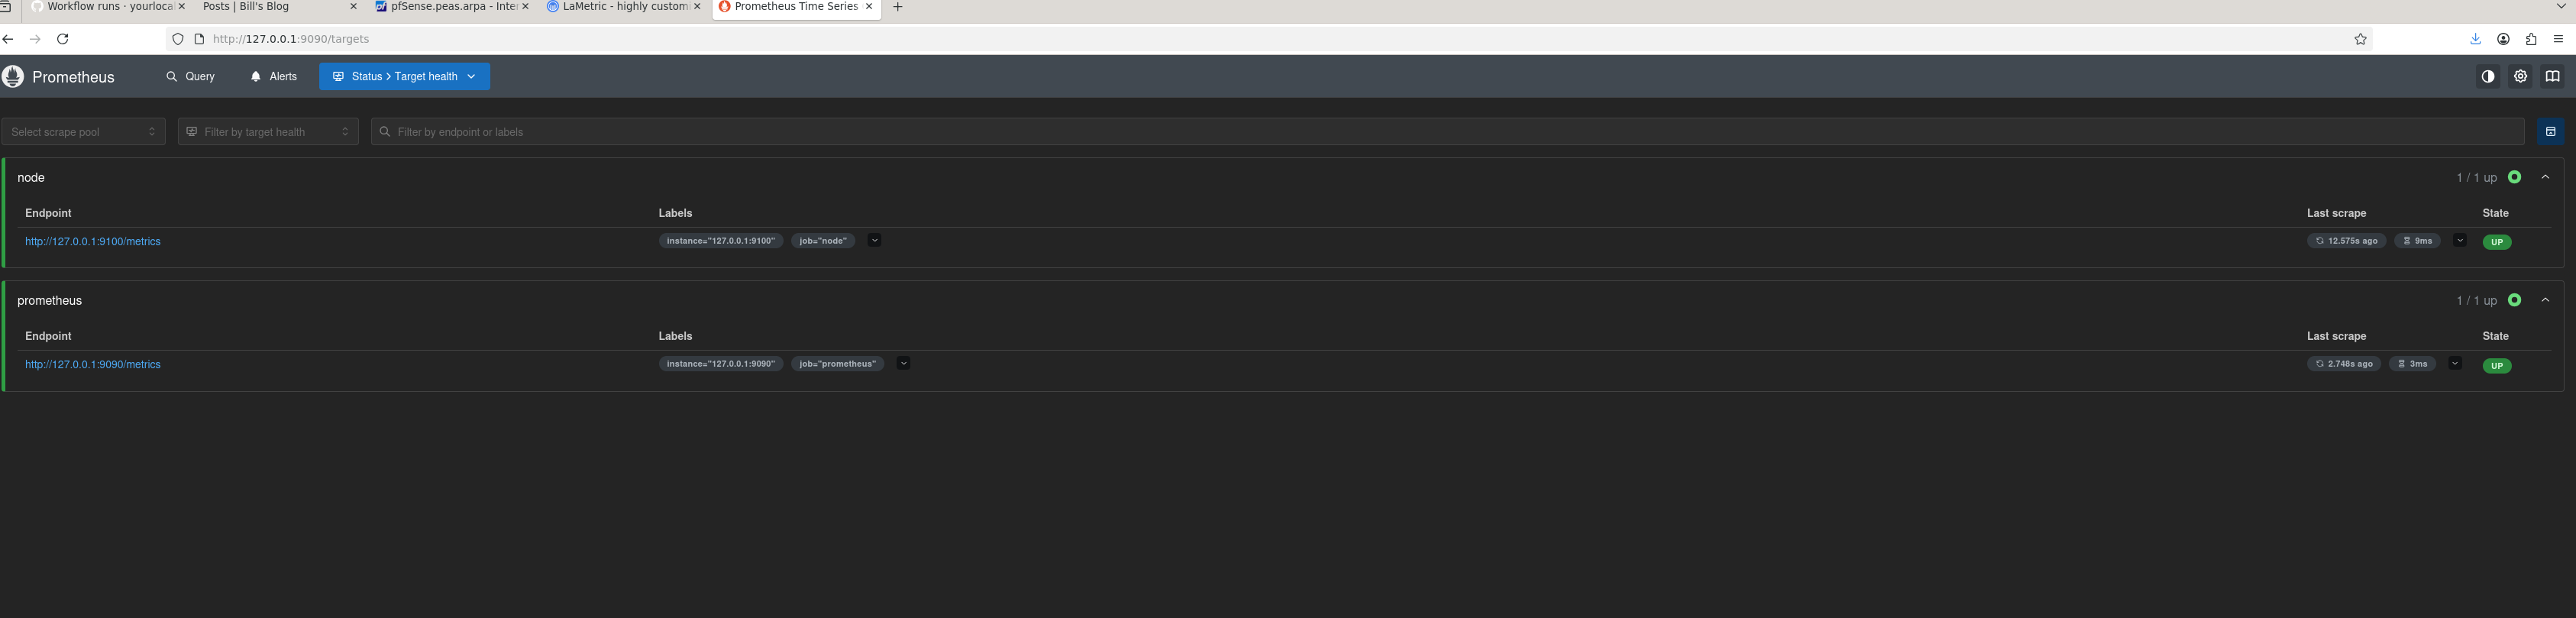
127.0.0.1:9100/metrics. - Prometheus — installed with a config listing what to scrape (itself + node_exporter to start), then checked its
/targetspage showed both UP.
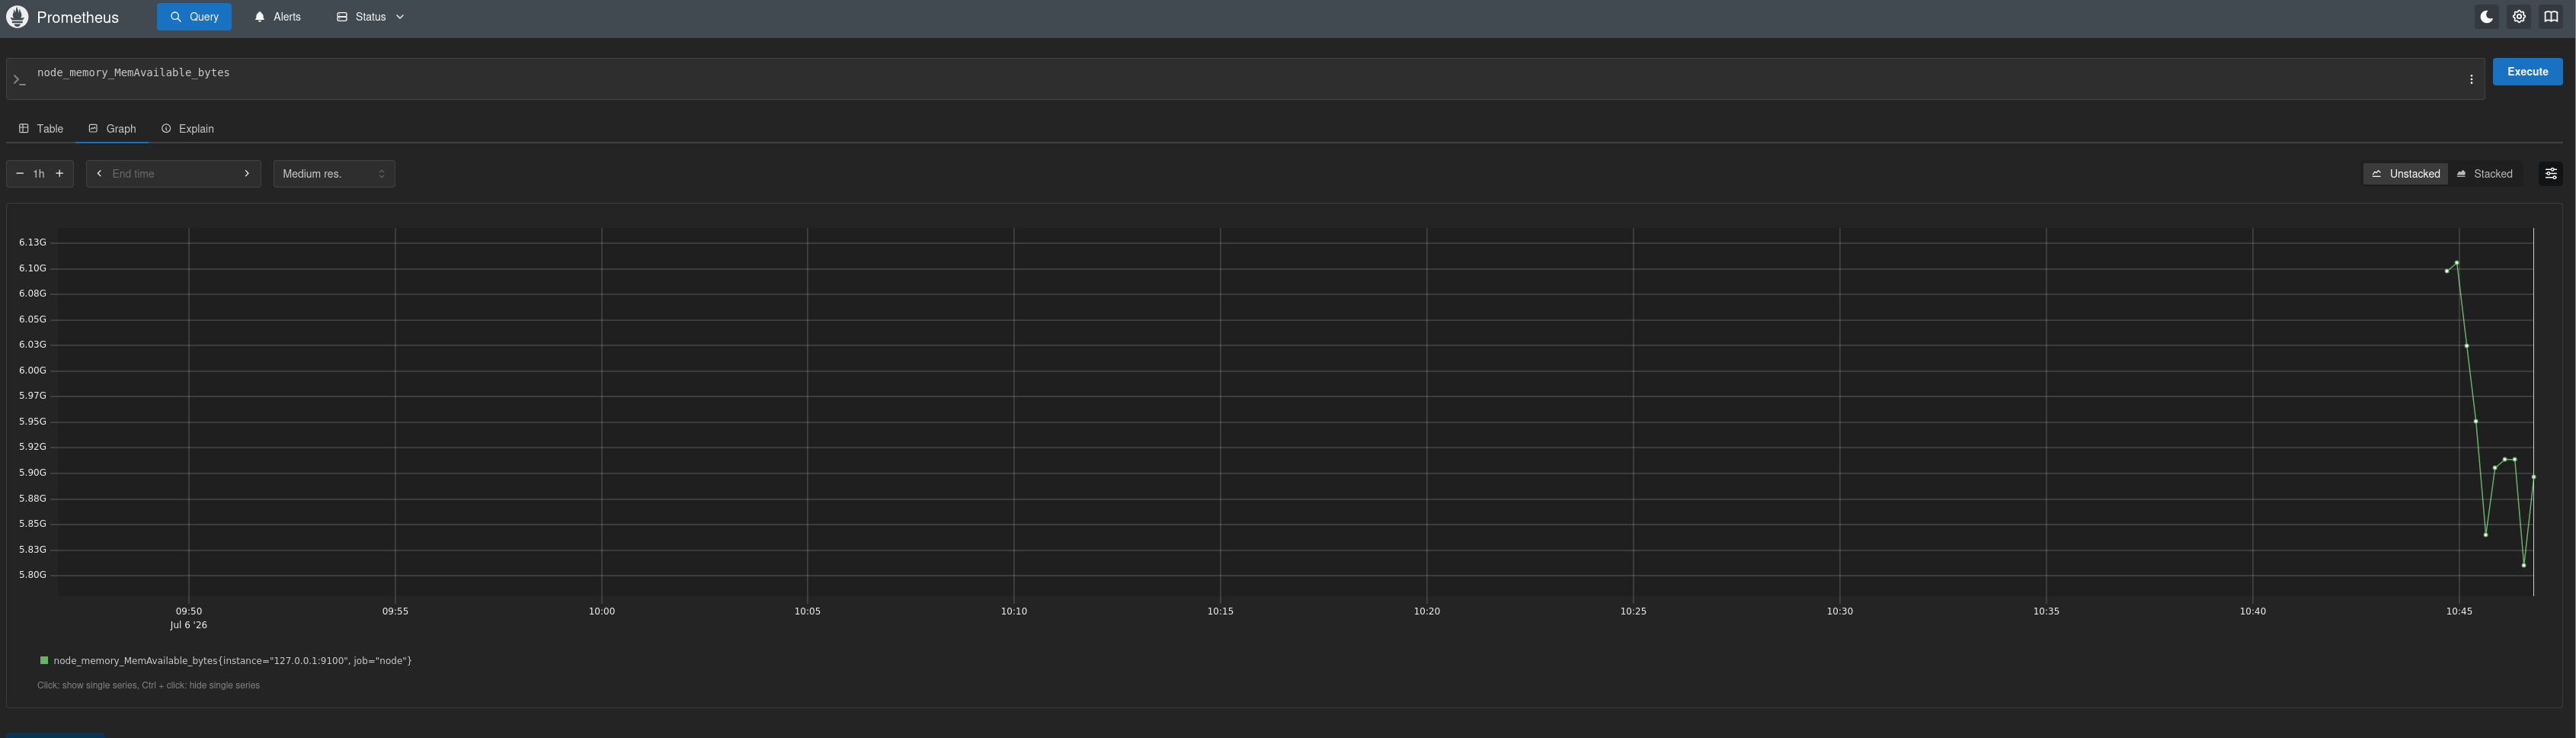
Prometheus’s own query UI confirmed the data was flowing before I built anything on top of it:
- snmp_exporter — installed with its bundled config (which already includes an
if_mibmodule for interface counters). One edit: the default config only knows the communitypublic, so I added an auth block for my real read-only community. Tested directly withcurland got the pfSense interface counters back. - Wired pfSense into Prometheus — the one genuinely odd bit. Scraping SNMP needs a
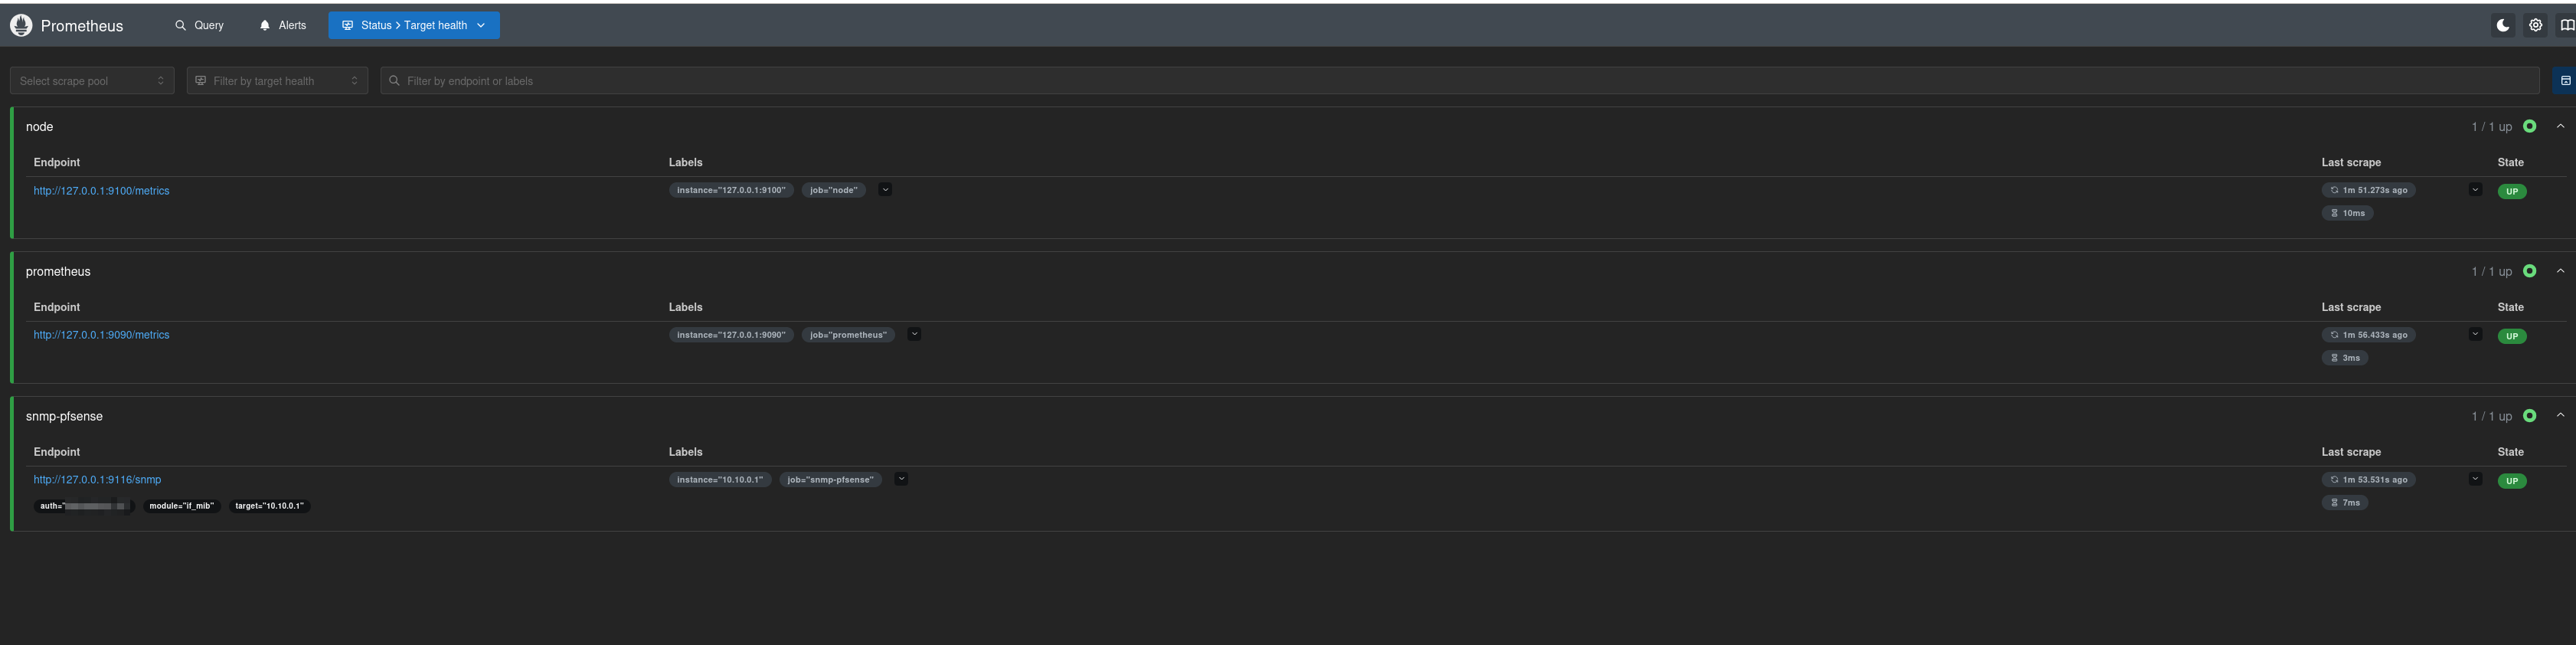
relabel_configsblock that reads as a redirect: Prometheus connects to the exporter (127.0.0.1:9116) but tells it to go query pfSense, and labels the results as pfSense’s. That indirection is the whole trick of SNMP-via-exporter. A third target,snmp-pfsense, then showed UP.
- Grafana — installed from its APT repo (so
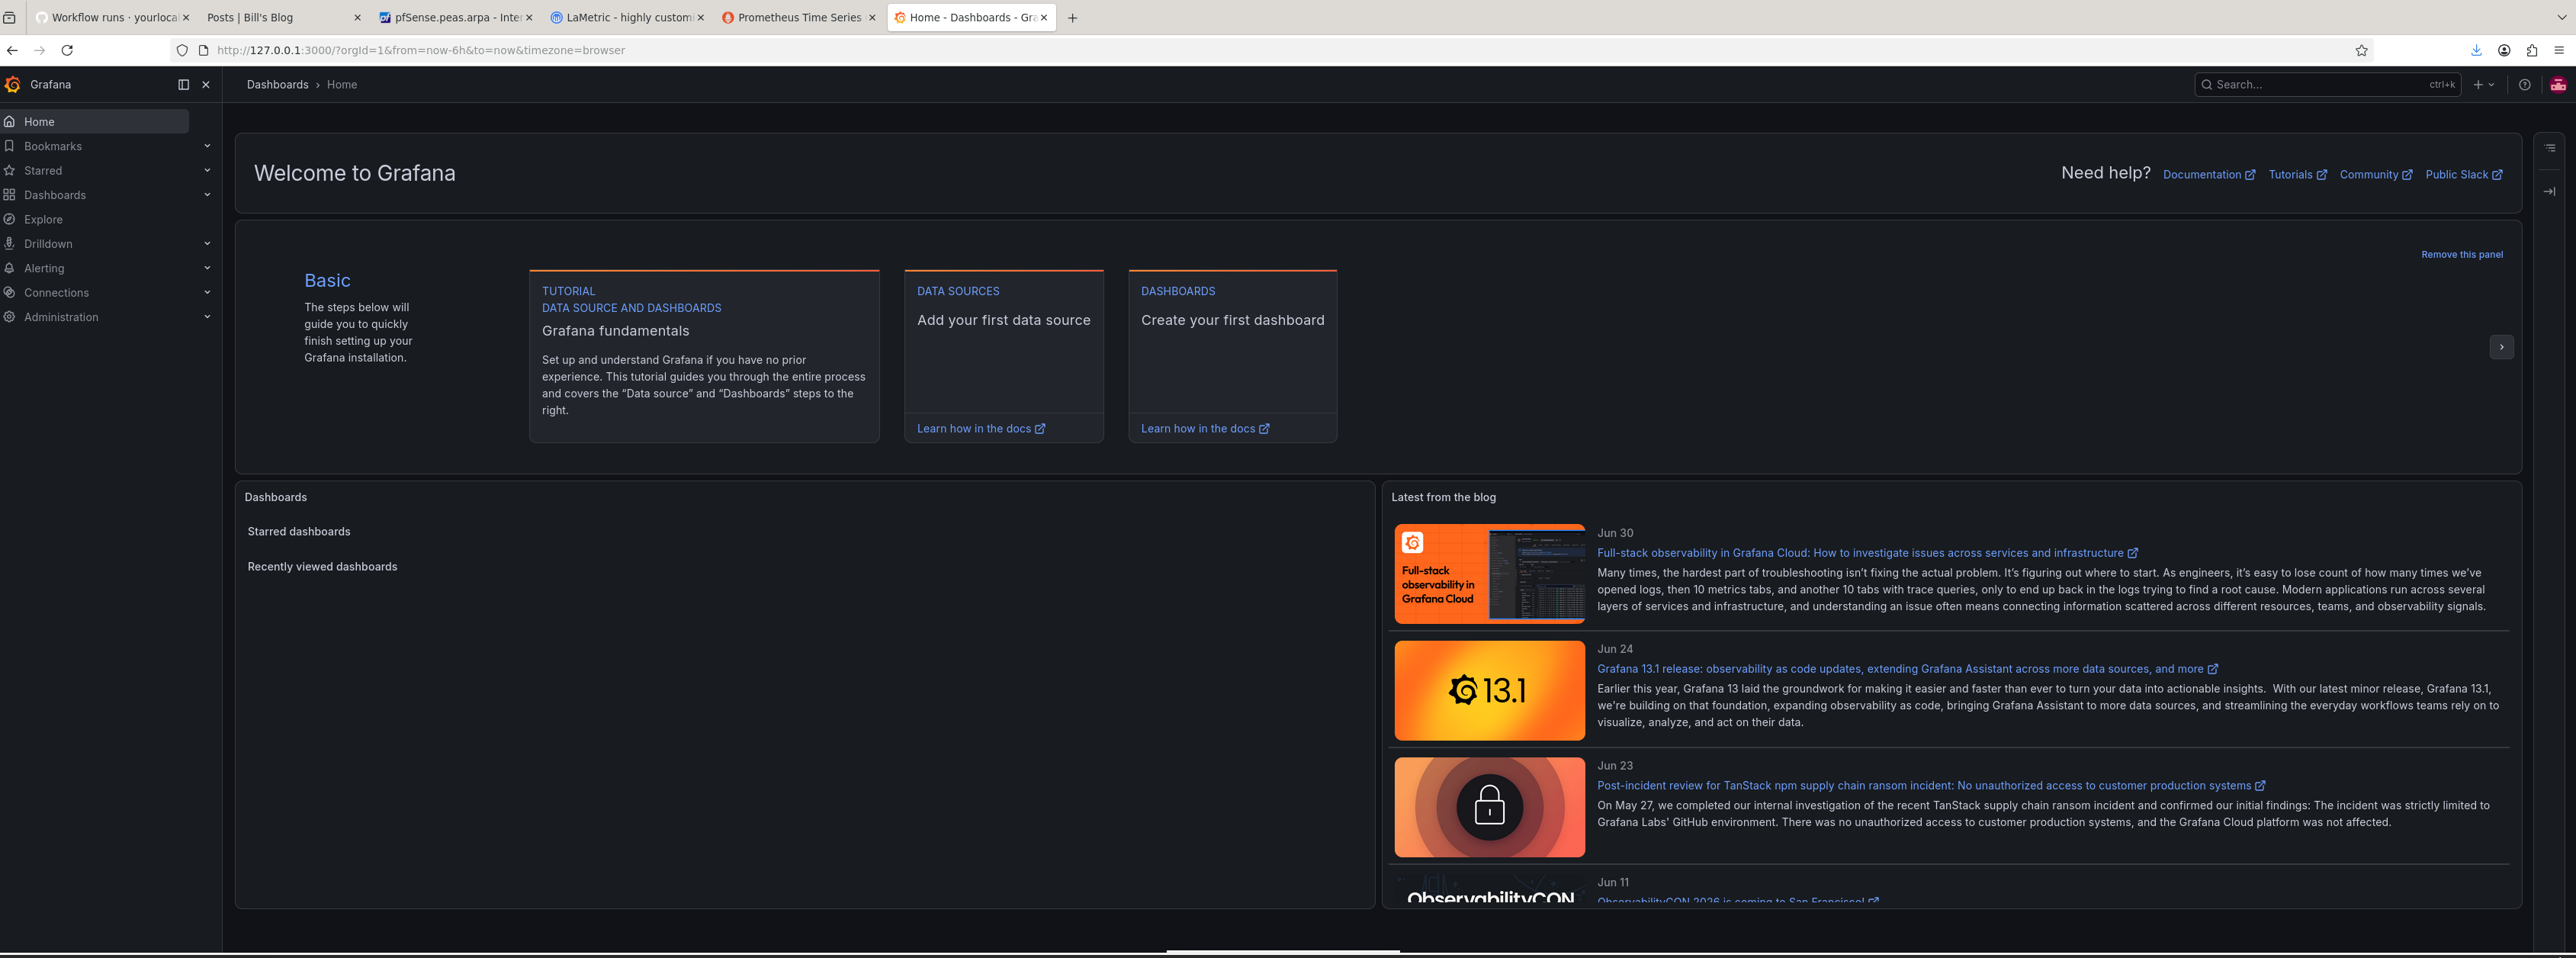
apt upgradekeeps it patched — worth it for anything with a login), bound to localhost, logged in, forced a new password.
- Connected and visualized — added Prometheus as a Grafana data source, then imported two prebuilt community dashboards by ID rather than building panels by hand:
- 1860 — Node Exporter Full, a comprehensive host dashboard.
- 11169 — an SNMP interface dashboard for the pfSense data.
Both lit up with live data almost immediately. Importing by ID is a genuinely useful trick — grafana.com hosts thousands of these, and they “just work” when the metric names match your exporter.
Security posture
Nothing here is exposed, which was the point:
- Everything binds to
127.0.0.1. The exporters have no authentication — they hand their metrics to anyone who asks — so localhost binding is essential, not optional. Grafana does have a login, but I bound it to localhost anyway: a login page that isn’t reachable can’t be attacked. - SNMP stays read-only with a non-default community, bound to pfSense’s LAN side only.
- Service users can’t log in or own files elsewhere — standard hardening for daemons that only need to run.
The gotchas
The parts that cost time:
- Prometheus 3.x dropped the old console templates. The install step to copy
consoles/andconsole_libraries/failed because 3.x no longer ships them (deprecated in favour of Grafana). Harmless — nothing uses them, so skip it. - A systemd unit choked on inline comments. I’d added comments after a line-continuation (
\) inExecStart, and systemd threwInvalid unit name. In a systemd unit, comments must be on their own line — never trailing a value or a continuation. software-properties-commondoesn’t exist under that name on Debian 13. It providesadd-apt-repository, which I wasn’t using — I added Grafana’s repo by writing the source file directly.- Prometheus briefly showed itself as down right after a restart — just the self-scrape not having run yet. It went green within 30 seconds. “Down” immediately after a restart usually means “not scraped yet,” not “broken.”
- The SNMP dashboard’s Uptime tile reads N/A. The
if_mibmodule only exposes interface data, not system uptime — cosmetic, and throughput (the thing I care about) works perfectly.
The result
A proper monitoring backbone: node_exporter and snmp_exporter feeding Prometheus, visualized in two live Grafana dashboards — one for CLAUDDEB’s health, one for the firewall’s interface throughput, both building history every fifteen seconds.
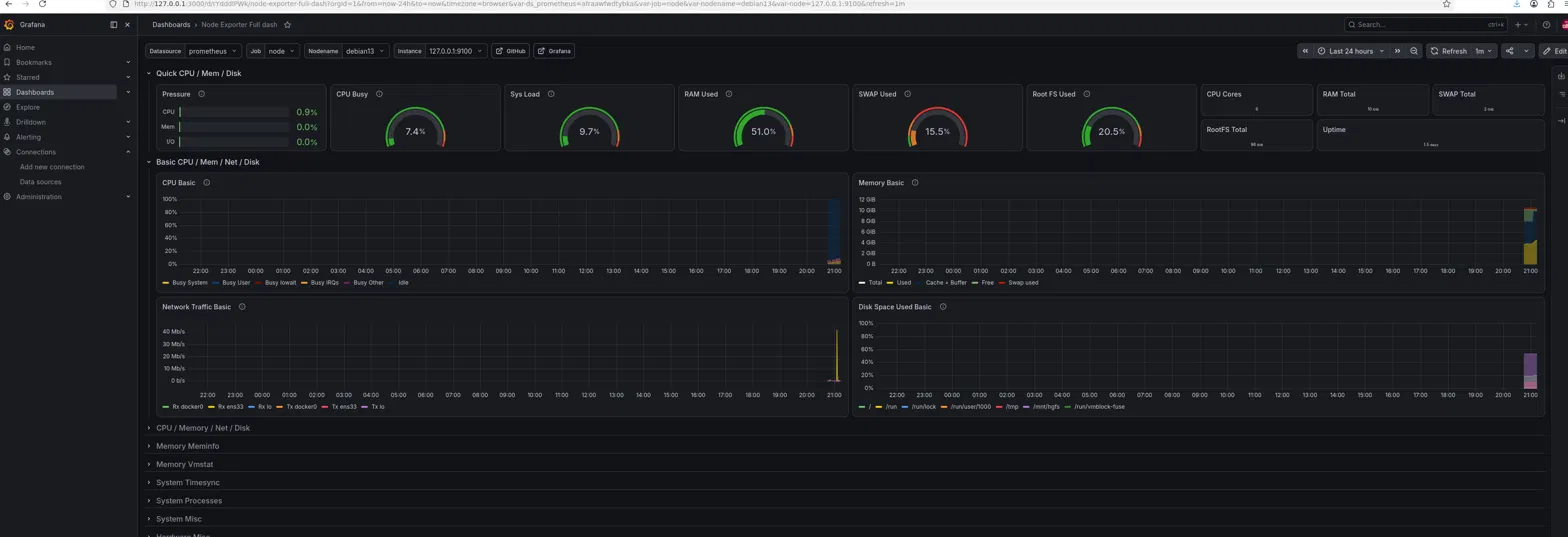
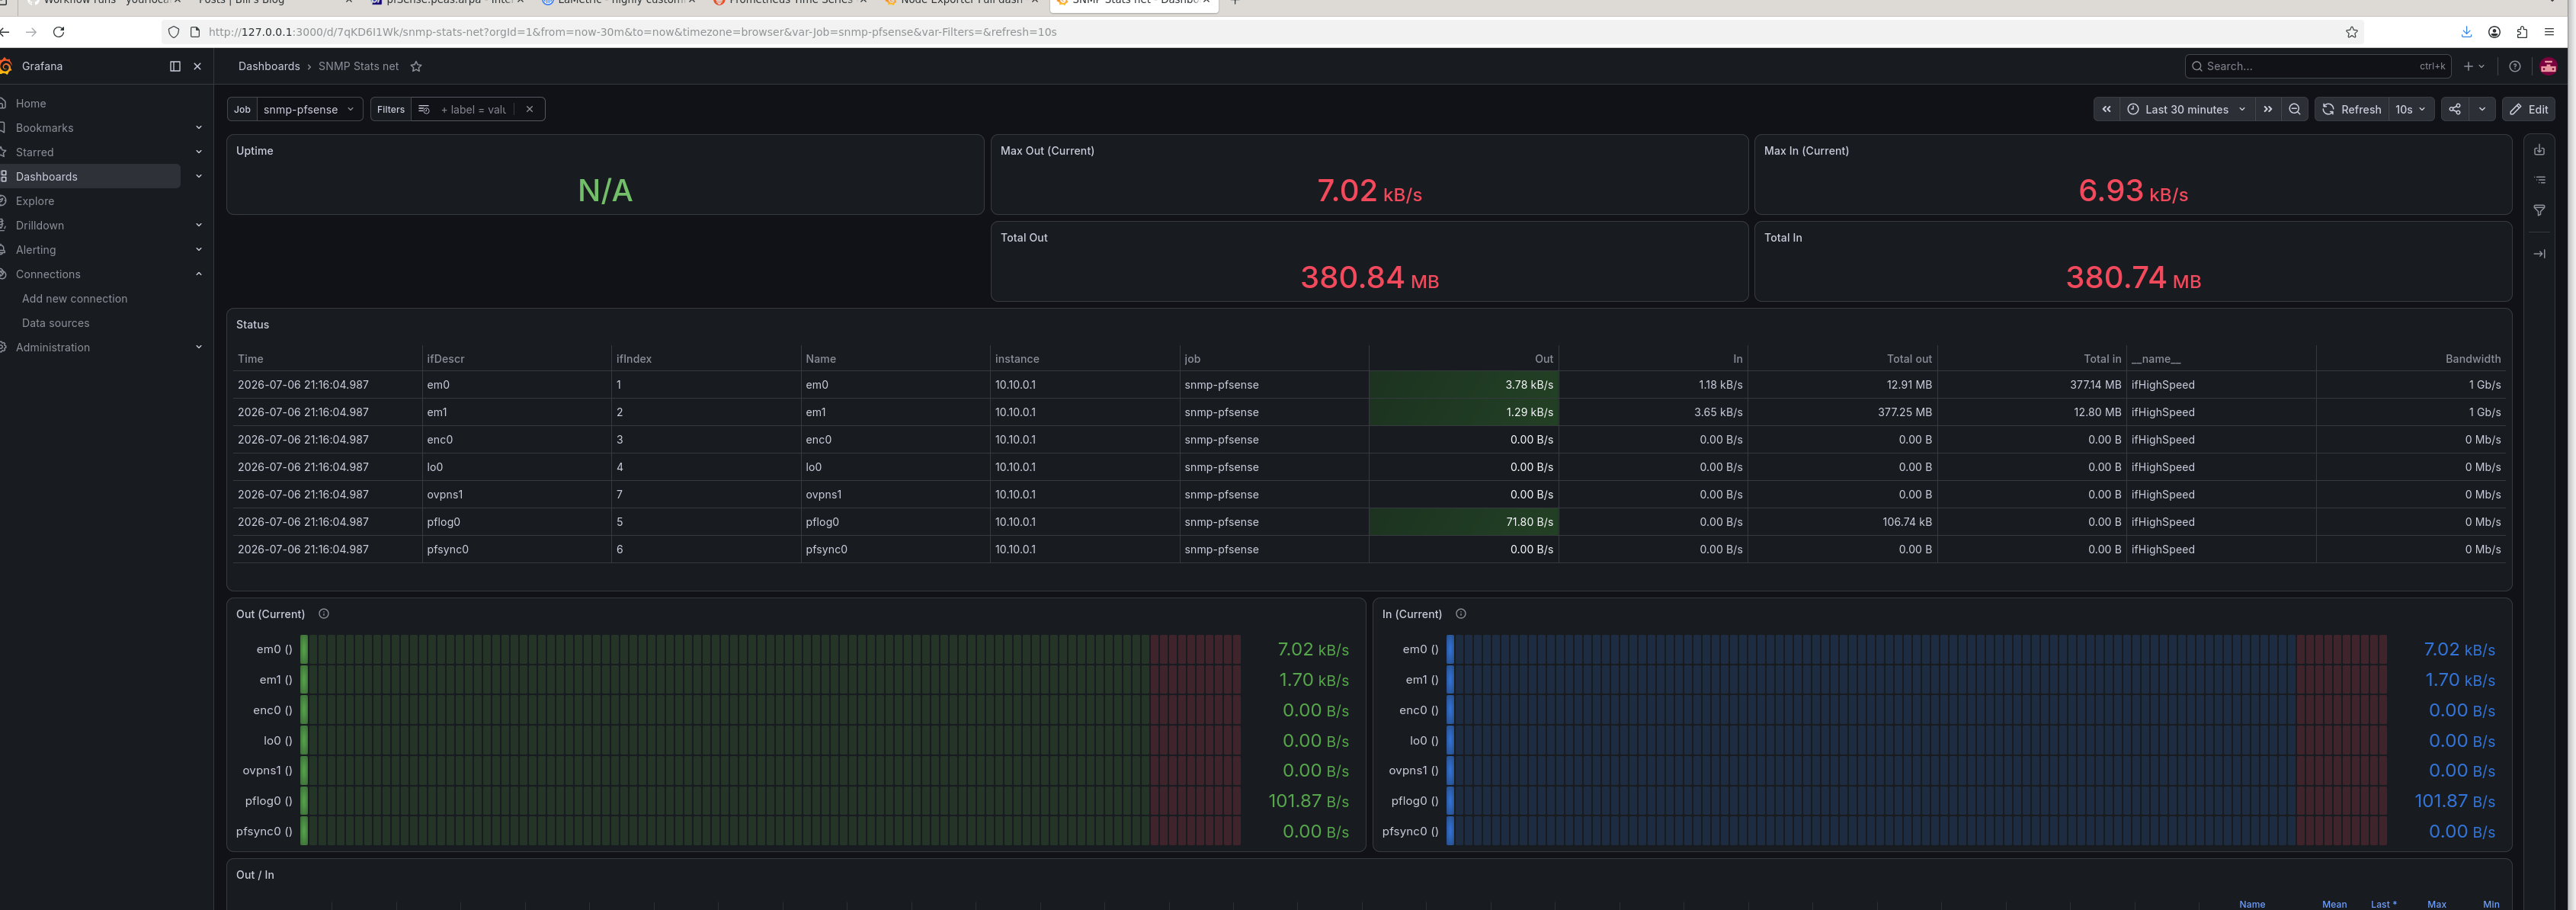
The disk-usage panels alone would have flagged the near-full root filesystem that bit me earlier, long before it caused trouble. The layering now makes sense end to end: the LaMetric is the glance, Grafana is the deep-dive, and Prometheus is the memory underneath both.
What’s next
The capstone is closing the loop. Grafana has an alerting engine, so a threshold breach — WAN throughput spiking, disk creeping past 85% — could fire a warning frame back to the LaMetric over the same MQTT broker from the first project. That would turn four separate builds into one connected system: metrics → alerting → a physical light on my desk.
The broader lesson is simple: a glance is not monitoring. A display tells you the current value; observability tells you the trend, the history, and when something started. Both are useful, but only one lets you answer the question that actually matters at 2am — what changed?