In part 1 I got a LaMetric Time showing live health from my home lab over MQTT, so it worked across my network isolation — CPU, memory, disk, uptime, and the automation VM’s own traffic, all from a single Debian box.
Useful, but those were really that box’s stats. The frame the display was named for is my network’s throughput — the traffic crossing my firewall — and that data lives on pfSense, not the Debian box. This is the follow-up: pulling real WAN in/out rates off pfSense over SNMP and putting them on the display. It’s shorter than the MQTT build, because the pipeline already exists; all I’m adding is a new data source. Getting numbers out of pfSense is the part worth writing down.
Why this one is reachable
My automation VM (CLAUDDEB) sits behind a virtual pfSense firewall that acts as its gateway and enforces RFC1918 containment rules, blocking it from the rest of my home network. The distinction that makes this project possible:
CLAUDDEB can’t route across pfSense to other segments, but it can reach pfSense itself. Querying your own default gateway isn’t the same as routing through it to somewhere you’re not allowed. SNMP from the VM to the firewall’s LAN interface is fair game, even though the VM can’t reach the LaMetric on the guest network. The isolation blocks lateral movement; it doesn’t blind a host to its own gateway.
The tools
- SNMP — the standard way network gear exposes operational data (interface counters, uptime, system info) for polling. The read path into pfSense.
- pfSense’s SNMP service (bsnmpd) — the built-in daemon, toggled under Services → SNMP, that publishes the firewall’s stats.
- IF-MIB interface counters — the data I’m after:
ifName(maps an interface name to its numeric SNMP index) andifHCInOctets/ifHCOutOctets(the byte counters for traffic in and out). - 64-bit (“HC”) counters — the original 32-bit octet counters wrap every few seconds on a fast link, wrecking any rate calculation. The 64-bit HC variants don’t realistically wrap, so the throughput math stays correct at speed.
- net-snmp client tools (
snmpwalk,snmpget—sudo apt install snmp) — the collector shells out to these rather than pulling in a heavyweight Python SNMP library. Rock-solid and easy to test by hand.
The MQTT pipeline, the Python publisher, and the systemd service from part 1 are reused unchanged — the new WAN data rides the same rails.
Configuring pfSense
Entirely in the web UI, under Services → SNMP:
- Enable the service.
- Set a Community String — never leave it as
public, the SNMP equivalent of a default password. I used a non-default, read-only name. - Under Interface Binding, bind the daemon to LAN — the side the VM reaches. Never bind SNMP to WAN; the firewall should not answer SNMP queries from the internet.
- Make sure the MibII module is enabled — it carries the interface counters, and without it the
ifHC*OIDs return nothing.
Two more things:
- Firewall rule. Because my LAN rules are restrictive, I had to permit traffic from the VM to the pfSense LAN IP on UDP 161. If your SNMP test times out, this is the first thing to add.
- Identify the WAN interface. Interfaces → WAN shows the underlying device name in parentheses — mine is
em0. SNMP identifies interfaces by index number, so pointing the collector at the wrong one would label LAN traffic as WAN.
The collector
The Python side does three things: resolve the WAN interface’s SNMP index by name, read its two HC octet counters a second apart, and turn the delta into Mbps. Resolving by name rather than a hard-coded index means it survives interface reshuffling.
def collect_pfsense(host, community, wan_iface, interval=1.0):
    result = {"reachable": False, "wan_rx_mbps": None, "wan_tx_mbps": None}

    # sysUpTime doubles as a reachability probe
    uptime = _snmp(["snmpget", "-v2c", "-c", community, "-Oqv",
                    "-t", "2", "-r", "1", host, _OID_SYSUPTIME])
    result["reachable"] = uptime is not None
    if not (wan_iface and result["reachable"]):
        return result

    idx = _resolve_ifindex(host, community, wan_iface)   # walk ifName, match, cache
    if not idx:
        return result

    in0  = _snmp_counter(host, community, f"{_OID_IFHCIN}.{idx}")
    out0 = _snmp_counter(host, community, f"{_OID_IFHCOUT}.{idx}")
    time.sleep(interval)
    in1  = _snmp_counter(host, community, f"{_OID_IFHCIN}.{idx}")
    out1 = _snmp_counter(host, community, f"{_OID_IFHCOUT}.{idx}")

    to_mbps = lambda d: max(d, 0) * 8 / 1e6 / interval
    result["wan_rx_mbps"] = to_mbps(in1 - in0)
    result["wan_tx_mbps"] = to_mbps(out1 - out0)
    return result
The index lookup walks ifName (falling back to ifDescr), matches the configured interface, pulls the index off the end of the OID, and caches it so it only runs once. If SNMP is unreachable, every path returns None and the frame shows WAN DL ? instead of the service crashing. Configuration is three lines in the existing .env:
PFSENSE_SNMP_HOST=<pfsense-lan-ip>
PFSENSE_SNMP_COMMUNITY=<your-community>
PFSENSE_WAN_IFACE=em0
The test that proves it
After enabling SNMP and installing the client tools, the single most useful command walks the interface-name table — it does double duty: if it returns anything, SNMP, firewall and community are all working, and its output is the list of interface names needed to identify WAN.
snmpwalk -v2c -c <community> <pfsense-ip> 1.3.6.1.2.1.31.1.1.1.1
...1.1 = STRING: "em0"      <- physical
...1.2 = STRING: "em1"      <- physical
...1.3 = STRING: "enc0"     <- IPsec (virtual)
...1.4 = STRING: "lo0"      <- loopback
...1.5 = STRING: "pflog0"   <- pf logging
...1.6 = STRING: "pfsync0"  <- state sync
...1.7 = STRING: "ovpns1"   <- OpenVPN server
Only em0 and em1 are real NICs; the rest are internal. The UI confirmed em0 is WAN, so that went into PFSENSE_WAN_IFACE.
To prove the counter reflects real WAN traffic before trusting the display, I ran two terminals on the VM — one generating a sustained download, the other polling em0’s raw in-octets counter every two seconds:
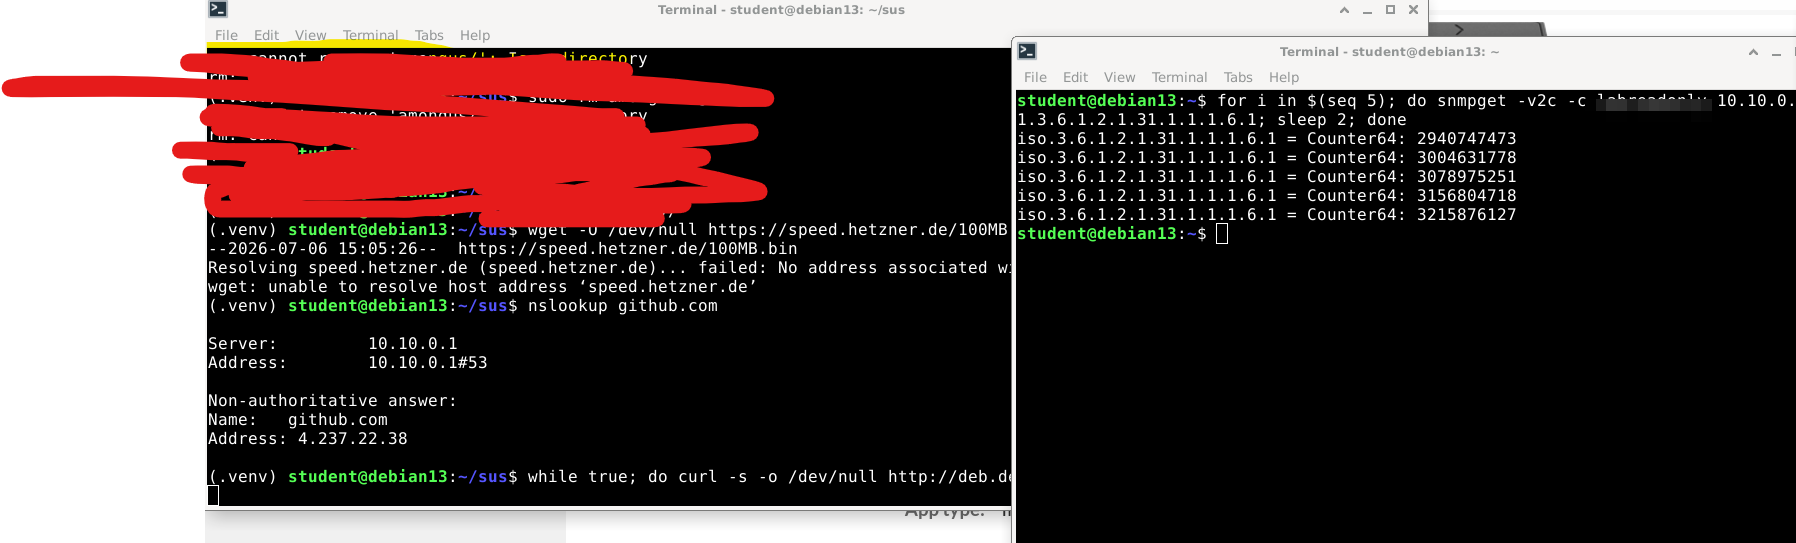
Counter64: 2940747473
Counter64: 3004631778
Counter64: 3078975251
Counter64: 3156804718
Counter64: 3215876127
Each two-second step jumps ~64 million bytes. Do the arithmetic — 64 MB ÷ 2 s × 8 bits ≈ 256 Mbps of real WAN traffic, live off the firewall’s counter. That’s the moment it went from “I think this works” to “this works.”
The last step was on the LaMetric app itself: it was built for 9 frames, so it capped there and hid the two new WAN frames. Same fix as always — edit the app in DevZone, bump it to 11 frames, republish, and force the device to re-pull. Then WAN DL / WAN UL joined the rotation.
The gotchas
The parts that cost time:
- Running the wrong copy of the script. My first test showed the old reachability frame and no WAN numbers, because I’d dropped the updated script into a second folder while the service still ran the original. One project, one directory — and
grepfor a string only the new version has before trusting a test. - Zero movement during a download — twice. The WAN frame sat at
0.0 Mbwhile I “downloaded something.” Two separate reasons: first the download was on a different machine, so it never crossed this firewall; then a real download on the VM finished between sample windows. The collector reads one second out of every sixty, so only sustained traffic registers — a small file is invisible. - DNS in the contained environment. My first test download host wouldn’t resolve — outbound name resolution is limited by design. I used a Debian mirror the VM could already reach.
- Which WAN is this, really? The conceptual one. The pfSense my VM sits behind is my lab firewall — its “WAN” is the boundary of the isolated lab segment, not my household internet uplink. So this frame reports traffic crossing that boundary. For a lab display that’s arguably the more interesting number, but it’s important to know exactly what you’re looking at.
A caveat worth stating
Because it samples one second per minute, the WAN frame is a spot reading, not a continuous meter — bursts between samples don’t show up, and it should never be mistaken for traffic accounting. It answers “is the link busy right now?” at a glance, which is all it’s meant to do. For a true interval average, the cleaner approach is diffing the counters across the full 60-second publish cycle instead of a 1-second sub-sample — an easy change I haven’t needed.
Security notes
Nothing here opened an attack surface, which was the point:
- SNMP is read-only with a non-default community string, so at worst it leaks stats to something already on my LAN.
- The daemon is bound to LAN only — never exposed to the internet, which is the classic mistake.
- The VM querying its own gateway stays entirely inside the isolation model — no lateral reach, no firewall holes, no port-forwards.
The result
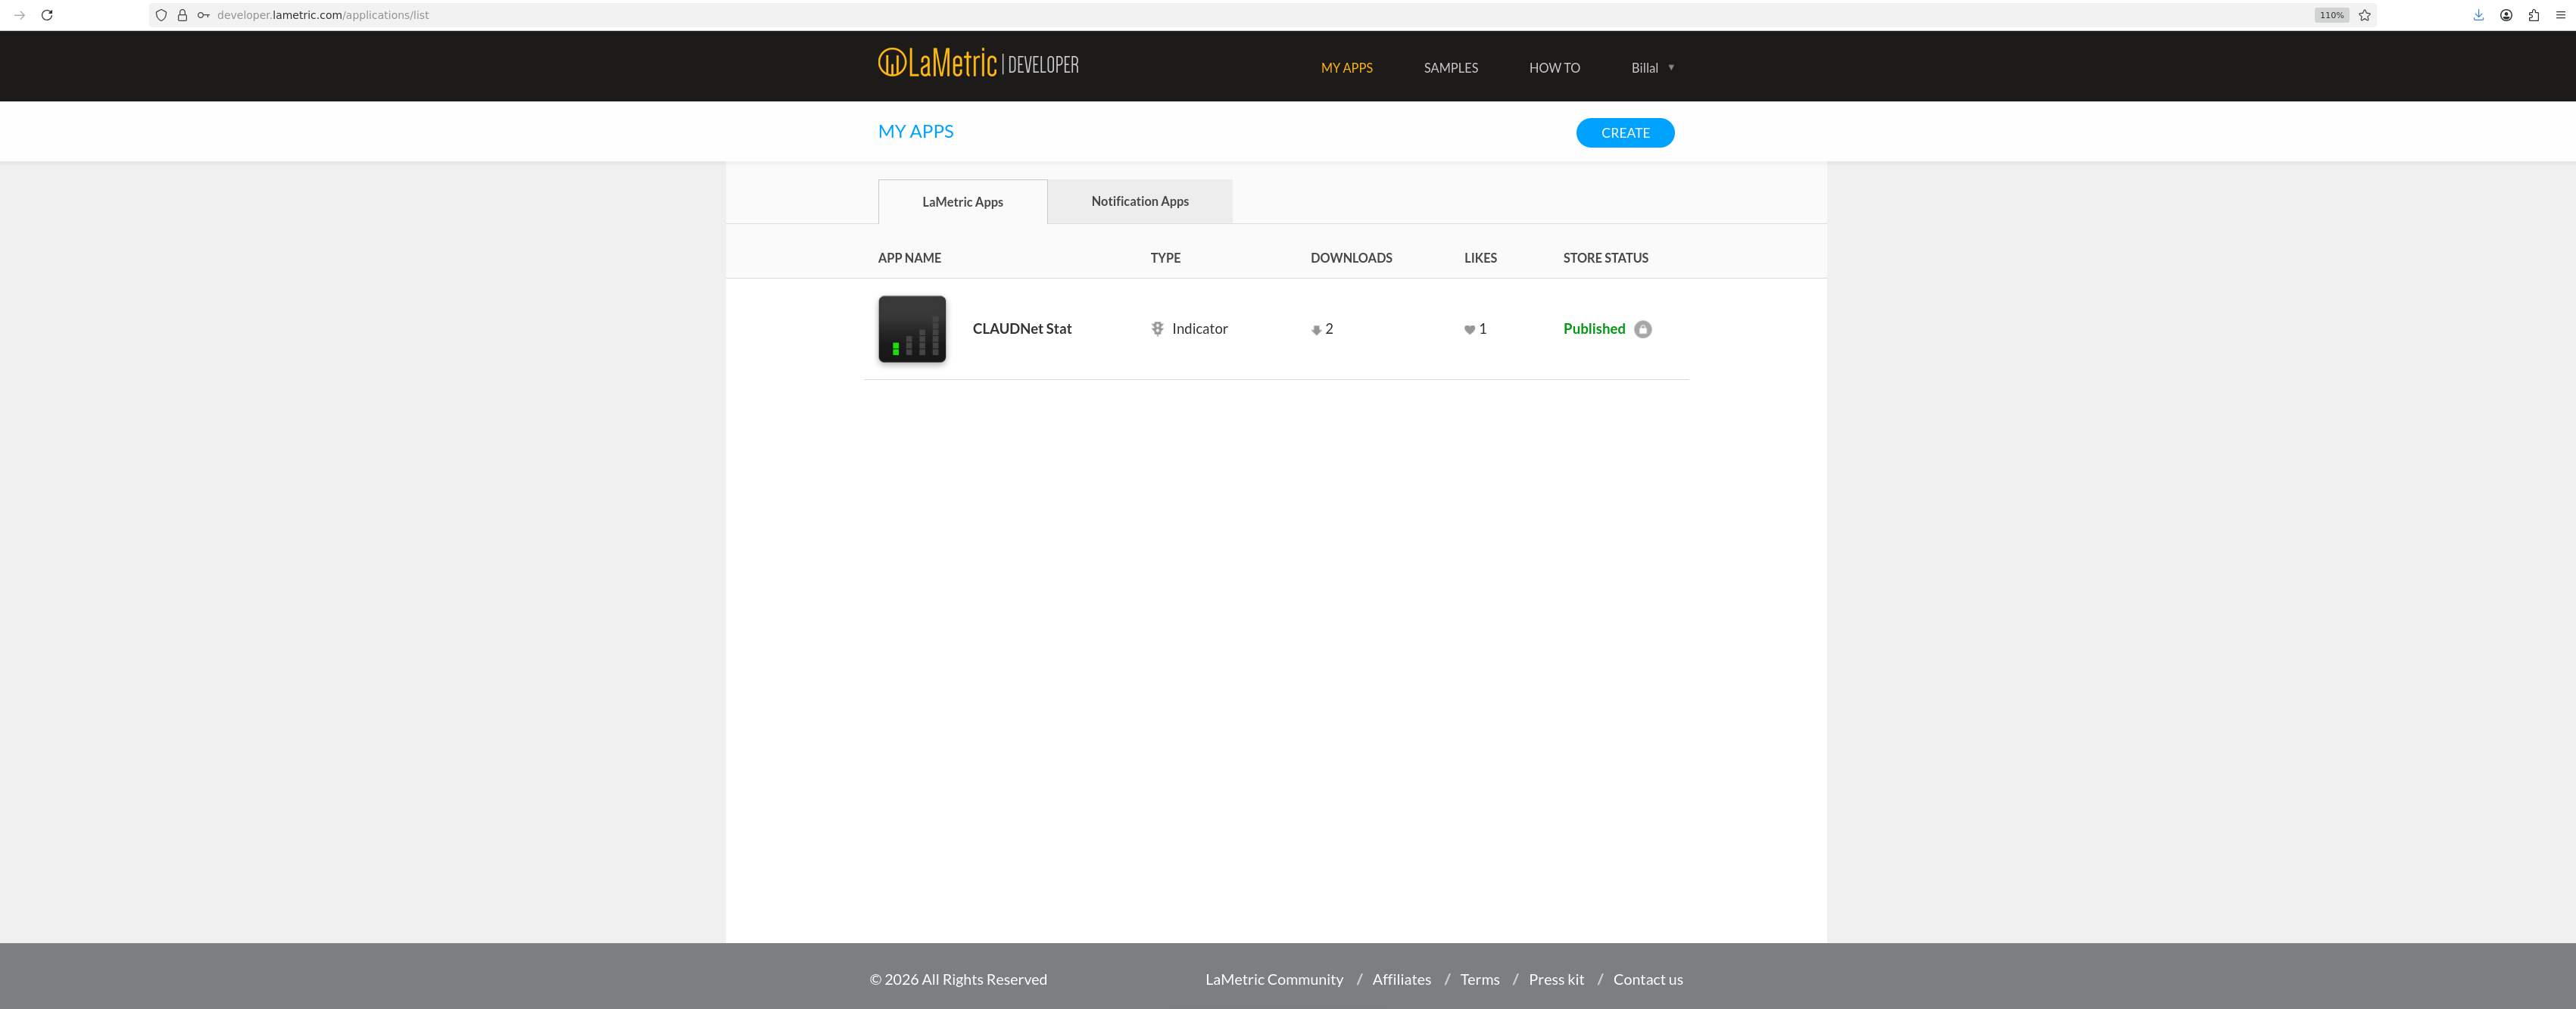
The display now cycles WAN DL and WAN UL frames showing real megabits per second in and out of my lab firewall, pulled over SNMP from a device the VM isn’t even allowed to route through — only to. Combined with the existing frames, it’s a genuine at-a-glance board for the whole segment: the VM’s own health on one side, the network boundary’s throughput on the other. The indicator app itself is published in the LaMetric store:
The broader lesson is small but useful: the data you want often isn’t on the box you’re standing on. SNMP is the boring, universal, decades-old answer to “let me read stats off that other device” — every switch, router, firewall and NAS speaks it. Once the WAN counters were flowing, the display finally lived up to its name.